Bitcoin Dumps 8% on Geopolitical Shock: Binance Liquidity Reveals Critical Pattern
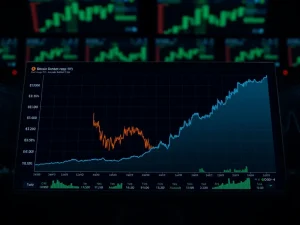
LONDON, March 15, 2026 — The price of Bitcoin (BTC) plummeted over 8% in early Asian trading hours today, breaching the $85,000 support level as renewed geopolitical tensions triggered a classic risk-off cascade across digital asset markets. The sudden Bitcoin dump, which erased approximately $180 billion from the total cryptocurrency market capitalization, coincided with a critical on-chain data point from analytics firm Glassnode. For the first time since late 2024, the aggregate liquidity supply on major exchange Binance has revisited levels not seen in over a year, while the amount of readily tradable BTC on exchanges has climbed. This confluence of price action and exchange flow data presents a familiar, yet potent, pattern for veteran analysts who recall similar market mechanics from previous geopolitical shocks in 2022 and 2024.
Bitcoin Dumps as Geopolitical Tensions Escalate
The immediate catalyst for today’s sell-off was a sharp escalation in diplomatic rhetoric between major global powers, reported by Reuters at 03:00 UTC. Consequently, traditional safe-haven assets like the US Dollar and Treasury bonds saw inflows, while equities and cryptocurrencies faced intense selling pressure. Bitcoin, often still correlated with tech stocks during acute risk aversion events, bore the brunt. Data from CoinMetrics shows the drop occurred on elevated volume, with over $4.2 billion in BTC spot volume traded in the first two hours of the move. “We’re witnessing a textbook flight to liquidity,” stated Marcus Thielen, Head of Research at crypto analytics firm 10x Research, in a note to clients. “The geopolitical headline acts as the spark, but the tinder was already dry due to over-leveraged long positions and a market that had become complacent after a strong Q1.”
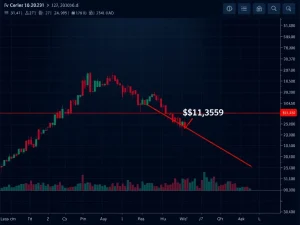
This event follows a 14-week period of relative stability for Bitcoin, which had been trading in a narrowing range between $88,000 and $92,500. The breakdown from this consolidation was rapid and decisive, catching many retail traders off-guard. On-chain data reveals a spike in transfer volume from accumulation addresses to exchange-associated wallets in the 12 hours preceding the drop, suggesting some larger holders were preparing to sell or hedge their exposure.
Binance Liquidity Supply Revisits 2024 Levels: A Key Signal
Parallel to the price decline, a more nuanced but equally significant development unfolded on the world’s largest cryptocurrency exchange. According to a real-time dashboard from CryptoQuant, the aggregate liquidity supply—comprising order book depth across major trading pairs on Binance—has retraced to levels last observed in November 2024. Simultaneously, the exchange’s BTC reserves, often called the “exchange net position change,” have increased by roughly 18,000 BTC over the past seven days. This indicates more coins are moving onto exchanges, potentially for sale. “When liquidity dries up and coins flood into exchanges, it creates a dangerous imbalance,” explained Lucas Outumuro, Head of Research at IntoTheBlock. “The buy-side order book becomes thin, meaning even moderate sell pressure can cause disproportionate price drops. We saw this play out almost identically during the March 2024 banking crisis.”
- Thinner Order Books: Reduced liquidity depth means larger market orders execute at worse prices, amplifying volatility.
- Increased Sell-Side Inventory: Rising exchange reserves represent readily available supply that can hit the market.
- Margin Call Domino Effect: In a low-liquidity environment, initial liquidations can trigger cascading liquidations across leveraged positions.
Expert Analysis from Institutional Desks
Institutional responses have been measured but alert. JPMorgan Chase’s blockchain and digital assets team, led by Nikolaos Panigirtzoglou, published a flash note highlighting the divergence between Bitcoin and gold. “While both are considered alternative assets, Bitcoin’s short-term correlation with risk assets remains high during shock events,” the note read. “Its maturation as a macro hedge is ongoing, not complete.” Meanwhile, a spokesperson for Binance confirmed the exchange’s systems operated normally throughout the volatility, with no outages reported. They emphasized that fluctuating liquidity is a normal function of market cycles and participant behavior.
Historical Precedents: How Similar Shocks Have Played Out
Examining past instances where Bitcoin faced sharp geopolitical shocks provides a framework for potential trajectories. The most relevant analogies are the initial sell-off following Russia’s invasion of Ukraine in February 2022 and the regional banking crisis-induced volatility of March 2024. In both cases, an initial violent dump was followed by a period of high volatility and basing before a trend resumed. A critical differentiator was the underlying strength of Bitcoin’s network fundamentals, such as hash rate and HODLer accumulation patterns, at the time of the shock.
| Event | Initial BTC Drop | Time to Recover Pre-Shock Price | Key Market Condition |
|---|---|---|---|
| Ukraine Invasion (Feb 2022) | -12.5% | 42 days | Pre-FTX; High leverage |
| March 2024 Banking Crisis | -9.8% | 14 days | Post-FTX; Strong ETF inflows |
| Current Shock (March 2026) | -8.2% (as of press time) | TBD | Mature ETFs; Rising exchange liquidity |
Forward-Looking Analysis: What Traders and Investors Watch Next
The immediate focus for market participants shifts to two key metrics: the stabilization of Binance liquidity and the behavior of long-term holders. If exchange reserves begin to decline, it would signal absorption of the sell-side pressure. Conversely, continued inflows would suggest further distribution. Additionally, the options market provides clues; the put/call ratio and the volatility skew will reveal whether professional traders are pricing in further downside or beginning to hedge for a rebound. Scheduled macroeconomic data, including US CPI figures due later this week, will now interact with this new, more fragile market sentiment.
Community and Miner Reactions to the Volatility
Initial reactions across social trading platforms like X (formerly Twitter) and trading discords showed a mix of panic and opportunistic buying. Retail sentiment gauges, such as the Crypto Fear & Greed Index, are expected to swing sharply from “Greed” into “Fear” territory. On the infrastructure side, Bitcoin miners, whose margins are directly impacted by price, have not shown signs of capitulatory selling on-chain, according to data from ByteTree. This suggests core network operators view the drop as a short-term event rather than a fundamental regime change.
Conclusion
The Bitcoin dump triggered by today’s geopolitical shock underscores the asset’s ongoing sensitivity to macro risk sentiment, especially when combined with deteriorating exchange liquidity conditions as seen on Binance. While historical patterns suggest such events often create volatile buying opportunities once the initial panic subsides, the current market must first navigate the twin challenges of elevated exchange supply and thin order books. The coming days will be critical for observing whether long-term holders step in to absorb the selling, a behavior that marked the local bottoms in both 2022 and 2024. For now, the market narrative has swiftly shifted from bullish consolidation to risk management and capital preservation.
Frequently Asked Questions
Q1: Why did Bitcoin’s price drop so sharply on March 15, 2026?
The primary catalyst was a sudden escalation in geopolitical tensions, which triggered a broad “risk-off” sentiment across financial markets. This was exacerbated by thin liquidity on major exchanges like Binance, causing amplified price moves.
Q2: What does ‘Binance liquidity supply revisiting 2024 levels’ mean for traders?
It means the depth of buy and sell orders on the exchange is as shallow as it was in late 2024, a period of significant volatility. This makes the market more prone to large price swings from relatively small trades, increasing risk.
Q3: How long do Bitcoin shocks from geopolitical events typically last?
Based on the 2022 and 2024 precedents, the initial sharp drop often lasts hours to a day, but the period of elevated volatility and price discovery can extend for 2 to 6 weeks before a clear trend re-emerges.
Q4: Should I buy Bitcoin after a big drop like this?
Investment decisions are personal. Historically, sharp drops have presented opportunities, but they also carry high risk. It’s crucial to assess your risk tolerance, consider dollar-cost averaging, and never invest more than you can afford to lose.
Q5: How is this event different from the crypto sell-offs in 2022?
The key difference is market structure. In 2022, the market was plagued by excessive leverage and centralized platform failures (e.g., FTX). Today, leverage is lower, and the market is supported by regulated spot Bitcoin ETFs, though liquidity concerns remain.
Q6: What is the single most important metric to watch now?
Many analysts point to the change in Bitcoin exchange reserves. If the flow of BTC onto exchanges like Binance reverses and coins start moving back into cold storage, it would be a strong signal that selling pressure is being absorbed.