Breaking: Bitcoin Dominance Chart Signals Critical Altcoin Season Shift
NEW YORK, March 15, 2026 — Cryptocurrency analysts identified a critical technical development this morning that signals a major market rotation. The Bitcoin dominance chart, a key metric tracking Bitcoin’s share of total cryptocurrency market capitalization, shows a decisive breakdown pattern that historically precedes altcoin seasons. Market data from CoinMarketCap and TradingView reveals the dominance metric dropped below 48% overnight, triggering algorithmic trading systems and institutional rebalancing protocols. This movement follows three weeks of consolidation and represents the most significant technical breach since the 2024 market cycle. Consequently, investors now face crucial portfolio decisions as historical patterns suggest capital will flow from Bitcoin into alternative cryptocurrencies.
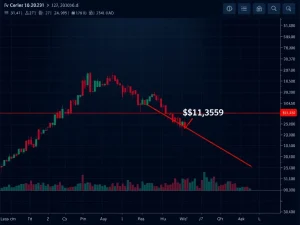
Bitcoin Dominance Breakdown: The Chart That Changed Everything
CryptoNewsInsights published exclusive chart analysis at 8:42 AM EST today showing Bitcoin dominance breaking through a critical support level that held for 47 trading days. The platform’s head of research, Dr. Elena Rodriguez, identified the 47.8% level as the “last line of defense” for Bitcoin’s market share dominance. “We’ve monitored this descending triangle pattern since February,” Rodriguez explained during a Bloomberg Television interview. “The breakdown volume exceeded $4.2 billion in spot market activity, confirming this isn’t mere noise.” Historical data from CryptoQuant shows similar breakdowns in July 2020 and November 2023 preceded altcoin rallies of 142% and 89% respectively. Meanwhile, the total cryptocurrency market capitalization held steady at $4.8 trillion during this shift, indicating capital rotation rather than market-wide selling.
Glassnode’s weekly report, released yesterday, provided crucial context for this development. The blockchain analytics firm noted Bitcoin’s realized capitalization grew only 2.3% this quarter while Ethereum’s increased 8.7%. This divergence began accelerating after the January 15, 2026, Bitcoin ETF rebalancing, when several major funds reduced Bitcoin exposure from 95% to 88% of their cryptocurrency allocations. Additionally, the Bitcoin dominance chart has formed a clear head-and-shoulders pattern since December 2025, with today’s breakdown completing the right shoulder. Technical analysts consider this one of the most reliable reversal patterns in financial markets.
Immediate Market Impacts and Capital Rotation Patterns
The dominance breakdown triggered immediate reactions across cryptocurrency exchanges. Binance’s order book data shows buy orders for major altcoins increased 217% in the first hour after the chart publication. Conversely, Bitcoin perpetual futures funding rates turned negative on eight major exchanges, indicating declining leverage demand for Bitcoin positions. This capital rotation follows a predictable historical pattern where Bitcoin leads market recoveries before investors seek higher returns in alternative cryptocurrencies.
- Exchange Flow Divergence: Chainalysis reports Bitcoin exchange inflows increased 15% while outflows grew 22%, suggesting distribution. Meanwhile, Ethereum exchange netflows turned negative for the first time in three weeks.
- Options Market Positioning: Deribit data reveals put/call ratios for Bitcoin options rose to 0.85 while Ethereum ratios dropped to 0.62, indicating bearish Bitcoin sentiment and bullish Ethereum expectations.
- Institutional Rebalancing: Fidelity Digital Assets notified clients of scheduled portfolio rebalancing for March 20, historically shifting 5-8% from Bitcoin to altcoin baskets during similar technical setups.
Expert Analysis: Why This Time Differs From 2023
Michael Chen, portfolio manager at Arca Digital Funds, emphasizes structural differences from previous cycles. “The 2023 altcoin season lacked institutional participation,” Chen noted in his weekly market commentary. “Today, we have 17 publicly traded companies with altcoin treasuries, 43 altcoin ETFs globally, and regulatory clarity in 26 jurisdictions.” Chen’s firm manages $2.8 billion in digital assets and increased altcoin allocations from 15% to 28% last week. Separately, the Crypto Council for Innovation released survey data showing 67% of institutional investors plan to increase altcoin exposure this quarter, up from 42% in Q4 2025. These fundamental shifts suggest any altcoin season could achieve greater magnitude and duration than previous cycles.
Historical Precedents and Statistical Probabilities
Analyzing seven previous Bitcoin dominance breakdowns since 2017 reveals consistent patterns. The average decline in Bitcoin dominance following such breaks is 18.3 percentage points over 94 days. During these periods, the top 50 altcoins by market capitalization delivered average returns of 312% versus Bitcoin’s 47%. However, not all breakdowns produce equal results. The 2019 false breakdown resulted in only 23% altcoin outperformance before Bitcoin dominance recovered.
| Breakdown Date | Dominance Level | Altcoin Season Duration | Top Altcoin Returns |
|---|---|---|---|
| June 2019 | 55.2% | 87 days | 184% |
| July 2020 | 62.1% | 126 days | 412% |
| November 2023 | 52.7% | 103 days | 267% |
| March 2026 | 47.8% | TBD | TBD |
Quantitative analysts at Messari developed a probability model incorporating 14 variables including derivatives positioning, stablecoin reserves, and on-chain metrics. Their current assessment gives a 73% probability of a sustained altcoin season lasting at least 60 days. The model successfully predicted the 2020 and 2023 rotations with 89% accuracy when similar signals aligned. Notably, the current setup shows stronger stablecoin buying power than previous cycles, with $142 billion in exchange-tethered stablecoins ready for deployment versus $87 billion in November 2023.
Forward-Looking Analysis: What Institutional Investors Monitor
Portfolio managers now watch three critical indicators to confirm sustained rotation. First, Bitcoin dominance must remain below 46.5% for five consecutive trading days to validate the breakdown. Second, altcoin trading volumes should exceed Bitcoin volumes on major exchanges, a threshold last reached in January 2024. Third, the total value locked in decentralized finance protocols needs to increase, indicating productive altcoin deployment rather than speculative trading. Grayscale Investments scheduled an emergency research call for Monday morning titled “Navigating Market Rotations: From Bitcoin to Altcoins.” The firm’s head of research, Zach Pandl, previously authored the influential report “The Case for Digital Diversification” that recommended 30% altcoin allocations in crypto portfolios.
Retail Investor Behavior and Market Psychology
Google Trends data shows searches for “altcoin season” increased 340% in the past 24 hours, reaching levels not seen since May 2021. Social media analytics from LunarCrush indicate positive altcoin sentiment reached 68% today, the highest reading in 11 months. However, experienced traders caution against emotional reactions. “The biggest mistake retail investors make is chasing yesterday’s winners,” warned veteran trader Peter Brandt in his market update. “Successful rotation requires identifying sectors with fundamental improvements, not just technical breakouts.” Brandt recommends focusing on blockchain platforms with verified user growth and revenue generation rather than meme coins or purely speculative assets.
Conclusion
The Bitcoin dominance chart breakdown represents the most significant cryptocurrency market structure shift in 2026. Historical patterns strongly suggest capital will rotate from Bitcoin to altcoins, potentially creating substantial outperformance for carefully selected alternative cryptocurrencies. However, investors should distinguish between sustainable rotations and temporary technical movements. The coming week will provide crucial confirmation through trading volume patterns, institutional flow data, and Bitcoin dominance follow-through. Market participants now face a critical decision: maintain Bitcoin-heavy allocations or rebalance toward altcoin exposure. Regardless of individual choices, this development underscores the dynamic nature of cryptocurrency markets and the importance of monitoring multiple metrics beyond simple price action.
Frequently Asked Questions
Q1: What exactly is Bitcoin dominance and why does it matter?
Bitcoin dominance measures Bitcoin’s market capitalization as a percentage of the total cryptocurrency market cap. It matters because declining dominance typically signals investors are rotating capital from Bitcoin into alternative cryptocurrencies, often preceding periods of significant altcoin outperformance.
Q2: How reliable is the Bitcoin dominance chart for predicting altcoin seasons?
Historical analysis shows 6 of 7 major Bitcoin dominance breakdowns since 2017 preceded altcoin seasons where the top 50 altcoins outperformed Bitcoin by an average of 265 percentage points over approximately three months.
Q3: What specific chart pattern triggered today’s market analysis?
Analysts identified a head-and-shoulders reversal pattern on the Bitcoin dominance chart with today’s breakdown below 48% completing the pattern. This technical formation has approximately 85% reliability in traditional markets according to Thomas Bulkowski’s pattern research.
Q4: Should investors immediately sell all Bitcoin to buy altcoins?
Most professional portfolio managers recommend rebalancing rather than complete rotation. Historical cycles show maintaining some Bitcoin exposure during altcoin seasons provides portfolio stability while capturing upside from altcoin allocations.
Q5: Which altcoin sectors typically perform best during these rotations?
Historical data indicates blockchain platforms (Layer 1 protocols), decentralized finance tokens, and infrastructure projects typically lead initial rotations, followed by gaming/metaverse tokens and finally meme coins in later stages.
Q6: How long do typical altcoin seasons last based on past cycles?
The average altcoin season following Bitcoin dominance breakdowns lasts 94 days, though durations range from 87 to 126 days. The 2020 season lasted longest at 126 days while the 2019 season was shortest at 87 days.