Breaking: Bitcoin Price Rebounds From Critical Channel Bottom – $475,000 Target In Play

LONDON, March 21, 2026 – The Bitcoin price has executed a decisive technical rebound from a crucial monthly support level, igniting intense debate among market analysts about the cryptocurrency’s next major trajectory. After testing the lower boundary of a multi-month ascending channel, Bitcoin (BTC) surged over 8% in the last 24 hours, stabilizing above the psychologically significant $60,000 mark. This pivotal move, confirmed by on-chain data from Glassnode and exchange flow metrics, places the market at a stark crossroads: a consolidation phase above its $60,000 fortress or a renewed assault on the stubborn $70,000 ceiling that has capped rallies for weeks. Consequently, some technical strategists are now mapping a long-term path that, if historical patterns repeat, could theoretically see Bitcoin approach the $475,000 region in a subsequent macro cycle, though they emphasize this remains a highly speculative projection dependent on numerous macroeconomic factors.
Bitcoin Price Rebound: Anatomy of a Critical Technical Move
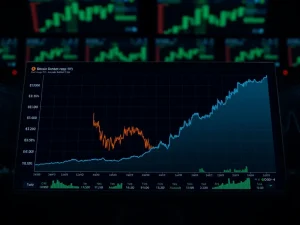
The Bitcoin price rebound from the monthly channel bottom was not an isolated event. It followed a 15% correction from local highs, which perfectly respected the lower trendline of a channel that has contained price action since the fourth quarter of 2025. Data from CoinMetrics shows exchange net outflows spiked to a 30-day high during the dip, indicating strong accumulation by long-term holders rather than panic selling. “The defense of the $58,500 to $60,000 zone was textbook,” noted Marcus Thielen, Head of Research at crypto analytics firm Matrixport, in a research note published Thursday. “On-chain support, measured by the aggregate cost basis of wallets that acquired Bitcoin in this range, held firm. This wasn’t just algorithmic trading; it was fundamental demand meeting a technical floor.” The rebound was further amplified by a surge in Bitcoin options activity, with the derivatives platform Deribit reporting a notable increase in call option purchases at the $65,000 and $70,000 strike prices for April expiry.
This price action creates a clear technical battleground. The immediate resistance cluster sits between $68,000 and $70,000, a zone that has rejected three separate rally attempts this year. A sustained break above this area, particularly on a weekly closing basis, would invalidate the current bearish divergence on several momentum oscillators and likely trigger a wave of algorithmic buy orders. Conversely, a failure to hold above $62,000 could see the price retest the channel bottom, potentially threatening a breakdown. The current volatility, as measured by the Bitcoin Volatility Index (BVIN), remains elevated but has begun to compress, a pattern that often precedes a significant directional move.
The $475,000 Thesis: Extrapolation from Historical Channel Dynamics
The mention of a Bitcoin $475,000 target originates from a specific, long-wave technical analysis framework. Analysts applying logarithmic regression channels and measuring the amplitude of past bull market cycles observe a pattern of diminishing returns per cycle but consistent structural growth. For instance, the 2017 bull run saw an approximate 100x increase from its prior cycle low, while the 2021 cycle delivered roughly a 20x increase. A continuation of this pattern could project a 5x to 7x increase from the next major cycle low, which some models place between $65,000 and $80,000 if the current level forms a base. A 6x multiple from a $75,000 base would land in the $450,000 vicinity.
However, this projection is fraught with caveats. It assumes the continuation of Bitcoin’s historical stock-to-flow-like scarcity model in the face of potential regulatory shifts, the maturation of the ETF market, and unknown macroeconomic shocks. “While the math from channel extensions can be compelling, it’s a purely technical exercise,” cautioned Lyn Alden, a macroeconomist and founder of Lyn Alden Investment Strategy, in a recent interview. “The $475,000 figure is a model output, not a forecast. Its validity hinges entirely on Bitcoin maintaining its current adoption trajectory and monetary properties against future competition from central bank digital currencies and other store-of-value assets. The real driver will be network adoption, not chart lines.”
- Model Dependency: The target relies on specific charting techniques (log regression, channel replication) that may not account for black swan events or market saturation.
- Macroeconomic Overlay: Future Federal Reserve policy, global liquidity conditions, and geopolitical stability will exert far greater influence than any drawn trendline.
- Adoption Curve: The target presupposes continued exponential growth in user adoption, institutional custody, and use-case development, which is not guaranteed.
Institutional Perspective: Balancing Short-Term Reality and Long-Term Potential
Institutional voices are focusing on the immediate Bitcoin $60000 support and Bitcoin $70000 resistance dynamic while acknowledging the long-term structural case. A report from Fidelity Digital Assets, shared with clients this week, highlighted that Bitcoin’s correlation with traditional risk assets has declined to its lowest level in 18 months. This decoupling, if sustained, strengthens the argument for Bitcoin as a unique portfolio asset rather than a mere tech stock proxy. “The rebound from key support is a positive technical signal,” the report stated, “but the more significant development is the changing correlation profile. It suggests the market is beginning to price Bitcoin on its own merits.” Meanwhile, trading desks at major banks like JPMorgan have noted increased hedging activity from corporate treasuries and asset managers using Bitcoin options to protect downside or gain upside exposure, adding sophisticated liquidity to the market.
Comparative Market Structure: Then and Now
Understanding the current Bitcoin monthly channel bottom requires context from previous cycles. The nature of support and resistance has evolved dramatically with the entry of spot Bitcoin Exchange-Traded Funds (ETFs) in the United States, which now hold over 800,000 BTC collectively. These vehicles create a constant, regulated bid for the underlying asset, potentially muting volatility and creating more defined trading ranges—like the current channel—compared to the wild, retail-driven swings of past eras.
| Cycle Phase (Approx.) | Primary Support Mechanism | Typical Correction Depth |
|---|---|---|
| 2017 Bull Market | Retail FOMO & Exchange Listings | 30-40% |
| 2021 Bull Market | Institutional Narrative & Macro Inflation Hedge | 20-30% |
| 2025-2026 Range | ETF Flows & Technical/Derivative Levels | 15-25% |
This evolution suggests that while violent crashes may be less frequent, breaking out of well-established ranges like the $60k-$70k channel may require a more powerful, fundamental catalyst. Potential catalysts on the horizon include a definitive regulatory framework for digital assets in the U.S. and the European Union, or a sudden shift in monetary policy from major central banks.
What Happens Next: The Path Through Resistance
The immediate roadmap is technical. Analysts at trading firm QCP Capital outline two primary scenarios in their latest market update. The bullish scenario requires a daily close above $68,500 with rising volume, which would likely target a test of the all-time high near $73,800. The neutral-bearish scenario involves a rejection at $67,000 followed by a consolidation between $62,000 and $67,000, potentially lasting several weeks. On-chain data will be a key watchpoint; a decline in exchange reserves alongside the price holding steady would signal strong holder conviction, setting the stage for the next leg up. The monthly options expiry on March 28th, with a large concentration of puts at $60,000, adds a near-term mechanical pressure point that could induce volatility.
Trader Sentiment and On-Chain Signals
Despite the encouraging Bitcoin price rebound, trader sentiment remains cautiously optimistic rather than euphoric. The Crypto Fear & Greed Index, a composite metric of volatility, market momentum, and social media sentiment, currently reads “Neutral,” a marked contrast from the “Extreme Greed” readings that often coincide with market tops. This suggests there is room for sentiment to improve alongside price. Furthermore, data from Santiment shows that the supply of Bitcoin held on exchanges continues a steady, multi-year decline, now standing at just 11.8% of the total circulating supply. This long-term holder behavior creates a structurally tighter supply landscape, a fundamental underpinning for any future price appreciation, whether it reaches $70,000 or, in a much later cycle, becomes part of a narrative toward a $475,000 target.
Conclusion
The recent Bitcoin price action has delivered a critical test of underlying market strength, rebounding precisely from a major monthly technical support level. This move reaffirms the $60,000 zone as a formidable fortress of buyer interest, setting the stage for another clash with the $70,000 resistance ceiling. While the extraordinary long-term Bitcoin $475000 target captures imagination by extrapolating historical channel growth, the immediate focus for traders and investors remains the battle within the current range. The convergence of positive on-chain signals, institutional hedging activity, and neutral market sentiment provides a firmer foundation for this rebound than many prior rallies. The path forward will be dictated not just by chart patterns, but by the fundamental flows into Bitcoin ETFs, the broader macroeconomic landscape, and the network’s continued adoption. The rebound is clear; its sustainability is the next question the market must answer.
Frequently Asked Questions
Q1: What exactly is the “monthly channel bottom” that Bitcoin rebounded from?
The monthly channel bottom refers to the lower trendline of an ascending price channel that has contained Bitcoin’s trading action on monthly charts since late 2025. It represents a key area of technical support where buyer demand has historically emerged. The recent bounce from this level, around $58,500-$60,000, confirmed its significance.
Q2: How realistic is the $475,000 price target for Bitcoin?
The $475,000 figure is a highly speculative, long-term model projection based on extending historical bull market growth patterns into the future. While mathematically derived from certain charting techniques, it depends on Bitcoin maintaining its current adoption trajectory for over a full market cycle and faces immense uncertainty from future regulation, competition, and macroeconomics. Most analysts view it as a theoretical upper-bound scenario, not a near-term forecast.
Q3: What needs to happen for Bitcoin to break above the $70,000 resistance ceiling?
A sustained break above $70,000 likely requires a combination of factors: a significant increase in net inflows to spot Bitcoin ETFs, a positive shift in broader market risk sentiment, a decisive macroeconomic catalyst (like dovish central bank policy), and a weekly close above the level with high trading volume to confirm the breakout.
Q4: What does “ETF flows” mean and why is it important?
ETF flows refer to the net amount of money moving into or out of spot Bitcoin Exchange-Traded Funds (like those from BlackRock or Fidelity). Consistent net inflows mean these funds are buying more Bitcoin to back their shares, creating constant buying pressure on the underlying asset. This has become a primary fundamental driver of Bitcoin’s price in the current market structure.
Q5: How does the current market differ from the 2021 Bitcoin bull run?
The key differences are the dominant participants and products. The 2021 run was fueled largely by retail speculation, leverage, and narrative. Today, the market is shaped by institutional activity through regulated ETFs and derivatives, leading to potentially shallower corrections but also more stubborn resistance levels, as seen in the current $70,000 ceiling.
Q6: Should the average investor be focused on the $475,000 target or the $70,000 resistance?
For practical investment and risk management purposes, the immediate battle at the $70,000 resistance level is far more relevant. The $475,000 target is a multi-cycle, hypothetical projection. Investors should base decisions on near-term fundamentals, portfolio strategy, and risk tolerance, not on distant, model-dependent price targets.