Bitcoin Descending Pattern Echoes 2018 Bottom: The Critical $61,359 Price Point

Global cryptocurrency markets are closely monitoring Bitcoin’s price action as it forms a descending technical pattern that previously signaled the 2018 bear market bottom, making the $61,359 level a crucial battleground for market direction in 2025. This development follows several weeks of consolidation and comes amid shifting macroeconomic conditions that continue to influence digital asset valuations worldwide.
Bitcoin Forms Critical Descending Pattern
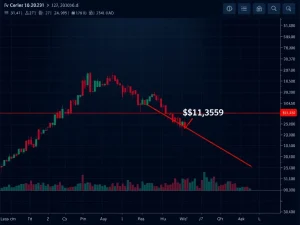
Technical analysts have identified a descending triangle formation on Bitcoin’s weekly chart that bears striking resemblance to the pattern that preceded the 2018 market bottom. This pattern typically forms when price makes lower highs while finding consistent support at a horizontal level. The current formation shows Bitcoin testing the $61,359 support level for the third time in recent weeks. Market participants are watching this level closely because descending triangles often precede significant breakouts or breakdowns. Historical data from previous cycles provides important context for understanding potential outcomes.
Several factors contribute to the pattern’s significance. First, the duration of the formation spans multiple months, increasing its technical validity. Second, trading volume patterns during the formation show decreasing activity, which often precedes volatility expansion. Third, the $61,359 level represents both psychological and technical support based on previous market behavior. Market analysts note that similar patterns in traditional financial markets have provided reliable signals about future price direction when combined with other confirming indicators.
Historical Parallels to 2018 Bear Market
The 2018 bear market provides important historical context for understanding current market conditions. Bitcoin reached its cycle peak near $20,000 in December 2017 before entering a prolonged downtrend. The market eventually bottomed around $3,200 in December 2018 after forming a descending triangle pattern similar to the current formation. Several key differences exist between the 2018 environment and current market conditions. Institutional adoption has increased significantly since 2018, with major financial institutions now offering cryptocurrency services. Regulatory frameworks have also evolved in many jurisdictions, providing clearer guidelines for market participants.
Market structure differences are equally important. The 2018 market featured limited derivative products and fewer institutional participants. Today’s market includes sophisticated financial instruments and more diverse investor profiles. These structural changes may influence how patterns play out in current conditions. Historical analysis shows that while patterns may repeat, their outcomes can vary based on market context and external factors. The 2018 bottom followed a period of excessive speculation and regulatory uncertainty, while current conditions reflect more mature market infrastructure and broader adoption.
Technical Analysis Perspective
Technical analysts emphasize several key observations about the current formation. The descending triangle pattern shows decreasing volatility as price approaches the apex, which typically precedes a volatility expansion. The $61,359 level represents both horizontal support and a psychological round number that often attracts trading activity. Volume analysis shows decreasing participation during the pattern formation, which may indicate accumulation or distribution depending on subsequent price action. Multiple time frame analysis provides additional context for understanding the pattern’s significance across different investment horizons.
Comparative analysis with other assets reveals interesting parallels. Some traditional financial assets have shown similar patterns during transitional market phases. The relationship between Bitcoin and traditional markets has evolved since 2018, with increased correlation during certain market conditions. This relationship may influence how the current pattern resolves relative to broader financial market trends. Technical indicators beyond price patterns provide additional context, including momentum readings, market breadth measures, and sentiment indicators that collectively paint a more complete picture of market conditions.
The $61,359 Price Point Significance
The $61,359 level represents more than just a technical support level. This price point corresponds with several important market metrics and historical reference points. First, it aligns with the 200-day moving average, a widely watched trend indicator in both traditional and cryptocurrency markets. Second, it represents a key Fibonacci retracement level from previous market movements. Third, options market data shows significant open interest at this strike price, indicating market participants have positioned around this level. These converging factors increase the level’s importance for determining future market direction.
Market microstructure analysis reveals additional insights. Order book data shows substantial liquidity accumulation around the $61,359 level across major exchanges. This liquidity concentration often serves as either support or resistance depending on market conditions. Derivatives market positioning indicates that many traders have established positions with this level as a reference point. The concentration of market interest around this price creates conditions for potential volatility expansion when the level is tested. Market participants are monitoring these developments closely as they may signal broader market trends.
Current Market Context and Conditions
Several macroeconomic factors influence current market conditions. Interest rate policies from major central banks continue to impact risk asset valuations globally. Inflation trends and economic growth projections create additional context for cryptocurrency market movements. Regulatory developments in major jurisdictions provide both opportunities and challenges for market participants. These external factors combine with internal market dynamics to create the current environment where technical patterns gain additional significance.
Market participant behavior shows interesting patterns. Institutional activity has increased relative to previous cycles, with more sophisticated trading strategies and longer investment horizons. Retail participation patterns have also evolved, with different demographic groups entering the market through various access points. These behavioral changes may influence how technical patterns resolve compared to historical precedents. The interaction between different participant groups creates complex market dynamics that technical analysis attempts to interpret through price patterns and volume data.
Potential Market Scenarios and Outcomes
Market analysts outline several potential scenarios based on the descending triangle pattern. A successful hold above $61,359 could lead to consolidation and eventual upward movement, particularly if accompanied by increasing volume and positive market developments. A breakdown below this level might test lower support areas, with subsequent price action depending on market conditions at that time. The pattern’s resolution will likely influence broader cryptocurrency market trends given Bitcoin’s dominant market position. Historical precedent provides guidance but doesn’t guarantee specific outcomes in current market conditions.
Risk management considerations are paramount for market participants. Position sizing, stop-loss placement, and portfolio diversification remain important principles regardless of technical patterns. The current environment emphasizes the importance of disciplined risk management given potential volatility expansion. Market participants should consider multiple scenarios rather than focusing exclusively on pattern-based predictions. This balanced approach acknowledges technical analysis value while recognizing its limitations in complex market environments.
Conclusion
Bitcoin’s formation of a descending pattern similar to the 2018 bear market bottom places significant emphasis on the $61,359 price point for determining future market direction. While historical parallels provide valuable context, current market conditions feature important differences including increased institutional participation and more mature market infrastructure. Technical analysis offers insights into potential outcomes but should be considered alongside fundamental factors and risk management principles. Market participants will continue monitoring this development as it may signal important trends for cryptocurrency markets in 2025 and beyond.
FAQs
Q1: What is a descending triangle pattern in technical analysis?
A descending triangle is a bearish chart pattern typically formed when price makes lower highs while finding consistent support at a horizontal level. It often precedes either breakdowns or breakouts depending on market conditions.
Q2: How does the current Bitcoin pattern compare to 2018?
The current pattern shows similar structure but occurs in different market conditions with more institutional participation, better regulatory clarity, and more sophisticated market infrastructure than existed in 2018.
Q3: Why is the $61,359 level particularly important?
This level represents technical support, aligns with key moving averages and Fibonacci levels, and shows significant options market interest and order book liquidity concentration across major exchanges.
Q4: What factors might influence how this pattern resolves?
Macroeconomic conditions, regulatory developments, institutional flows, market sentiment, and broader financial market trends may all influence the pattern’s resolution alongside technical factors.
Q5: How should traders approach this technical setup?
Traders should consider multiple scenarios, implement disciplined risk management, monitor confirming indicators, and avoid over-reliance on any single pattern or technical signal in isolation.