Ethereum Price Analysis: Decisive $1,866 Sweep Sparks Critical Debate Over $1,962 Breakout
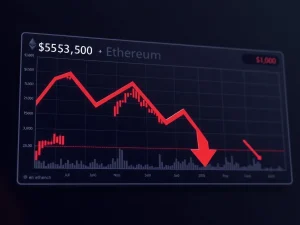
Global cryptocurrency markets witnessed a significant technical event on Thursday, March 13, 2025, as Ethereum (ETH), the world’s second-largest digital asset by market capitalization, decisively swept liquidity at the $1,866 level. This pivotal move triggered a cascade of long position liquidations across major derivatives exchanges, intensifying the debate among traders and analysts regarding Ethereum’s immediate trajectory. Consequently, the crucial question now dominating market discourse is whether ETH can muster the momentum to reclaim and break above the $1,962 resistance, a move that would fundamentally alter its short-term market structure and potentially unlock a path toward the $2,124 liquidity zone.
Ethereum Price Analysis: Deconstructing the $1,866 Liquidity Sweep
The recent price action saw Ethereum test and clear a concentrated cluster of stop-loss orders and liquidity pools situated near the $1,866 mark. In financial market terminology, a ‘liquidity sweep’ describes a price movement that intentionally triggers these clustered orders before reversing direction. This phenomenon is a common feature in both traditional and cryptocurrency markets, often orchestrated by large-scale participants. The immediate effect was a sharp, albeit brief, dip that liquidated over $45 million in leveraged long positions within a single hour, according to aggregated data from Coinglass.
This event must be contextualized within the broader, higher-time-frame trend, which market technicians currently classify as bearish. The prevailing downtrend has been in place since ETH failed to sustain momentum above the $2,400 level in late February. Key moving averages, such as the 50-day and 200-day Exponential Moving Averages (EMAs), continue to act as dynamic resistance on weekly charts. However, the successful sweep of the $1,866 level has introduced a potential inflection point. Market structure on lower time frames, such as the 4-hour and daily charts, now shows signs of compression, indicating a potential coiling period before a more decisive directional move.
- Liquidity Trigger: The sweep efficiently cleared a high-density order block.
- Derivative Impact: Resulted in significant long liquidations, reducing excess leverage.
- Structural Context: Occurred within a broader macro bearish trend but at a key historical support zone.
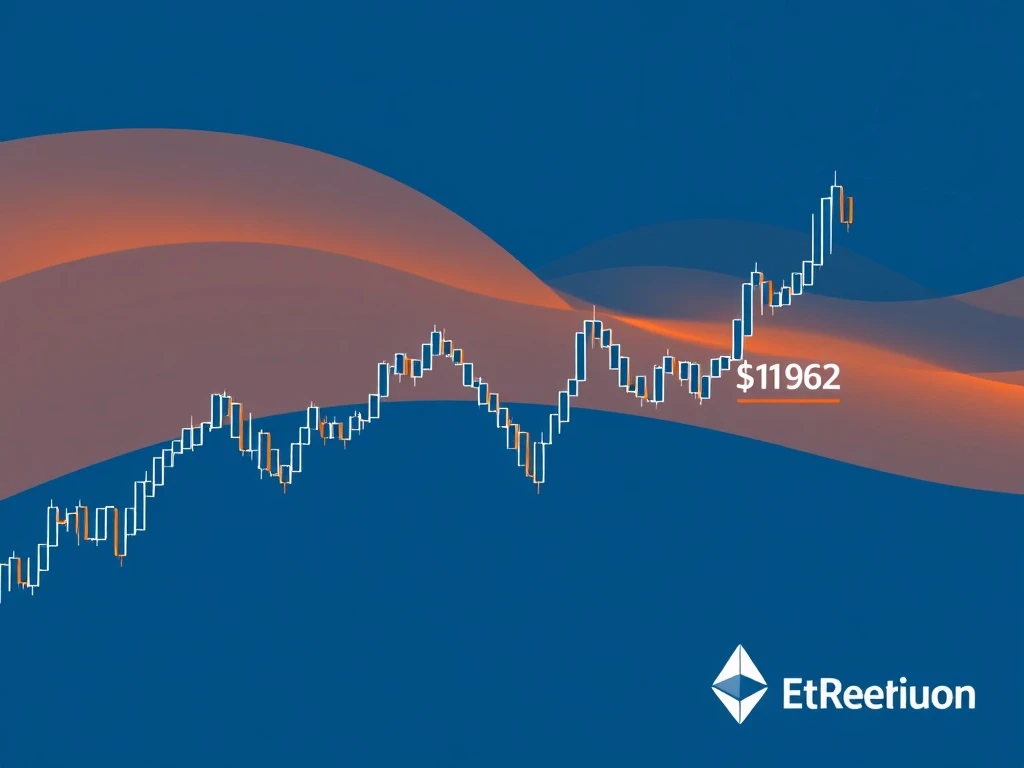
The $1,962 Pivot: A Line in the Sand for Ethereum Bulls
The $1,962 price level is not an arbitrary number; it represents a critical technical and psychological pivot for Ethereum. This level coincides with the previous weekly swing high from early March and aligns with a 0.382 Fibonacci retracement level measured from the recent downtrend. A confirmed daily close above $1,962 would accomplish several technical feats simultaneously. Primarily, it would break the series of lower highs that have defined the recent bearish structure, establishing a new higher high. This type of structural break is often a prerequisite for a trend reversal, or at minimum, a sustained corrective rally.
Successfully reclaiming this level would likely shift market sentiment, potentially attracting sidelined capital and forcing short-sellers to cover their positions. The next significant target beyond $1,962 resides near the $2,124 area, which is a known liquidity pool and a prior consolidation zone from February. Reaching this target would represent a gain of approximately 8.3% from the $1,962 breakout point. Analysts from firms like CryptoNewsInsights and Glassnode often monitor on-chain metrics such as Exchange Netflow and the Mean Dollar Invested Age to gauge whether price breakouts are supported by fundamental holder behavior or are merely driven by speculative derivatives activity.
Expert Insight: Reading the On-Chain Signals
Beyond pure price charts, on-chain data provides crucial context for Ethereum’s movements. According to analytics platform Santiment, the number of non-zero Ethereum addresses continues to reach all-time highs, indicating robust network adoption and a growing user base irrespective of price volatility. Furthermore, the balance of ETH on centralized exchanges has been on a consistent decline since the Shanghai upgrade, suggesting a trend toward long-term holding or staking. This reduction in readily sellable supply can act as a fundamental buoy against severe downside pressure. However, experts caution that macroeconomic factors, including interest rate decisions by the U.S. Federal Reserve and broader equity market performance, remain powerful external forces influencing crypto asset prices. The correlation between Ethereum and tech stocks, while diminished from its 2022 peak, still persists during periods of high macroeconomic uncertainty.
The Downside Scenario: Risks Below the $1,846 Local Low
While the breakout scenario garners attention, risk management necessitates a clear understanding of the bearish case. The immediate support level to watch is the recent local low at $1,846, established during the March 12th sell-off. A sustained break and daily close below this level would invalidate the potential bullish structure forming from the $1,866 sweep. Such a move would likely expose Ethereum to a retest of stronger support zones between $1,750 and $1,800, a region that provided a multi-month foundation throughout Q4 2024.
A breach of the $1,750 level would be a more serious technical development, potentially opening the door to a test of the 2024 yearly open near $1,650. Traders utilize various tools to manage this risk. The table below outlines key support and resistance levels based on volume profile and historical price action:
| Level | Type | Significance |
|---|---|---|
| $2,124 | Resistance / Target | Previous consolidation zone & liquidity pool |
| $1,962 | Pivot Resistance | Breakout level for trend change |
| $1,866 | Recent Support | Liquidity sweep zone, must hold for bulls |
| $1,846 | Local Support | Immediate downside invalidation point |
| $1,750 – $1,800 | Major Support | High-volume historical buying zone |
Market participants also monitor funding rates across perpetual swap markets. Persistently negative funding rates, as observed briefly after the sweep, can indicate excessive bearish sentiment, which sometimes precedes a sharp rebound as shorts are squeezed. Conversely, rapidly rising positive funding rates during a rally can signal over-leveraged longs and potential for a pullback.
Conclusion
Ethereum stands at a critical technical juncture following its liquidity sweep at $1,866. The price action has effectively reset some of the excessive leverage in the market, creating a cleaner slate for the next directional move. The focal point for traders and analysts is unequivocally the $1,962 level. A successful break above this resistance would disrupt the immediate bearish structure and set a clear course toward the $2,124 target. Conversely, failure to hold above the recent lows near $1,846 would reinforce the higher-time-frame bearish trend and likely lead to a test of deeper support zones. This Ethereum price analysis underscores the importance of key technical levels, on-chain fundamentals, and disciplined risk management in navigating the volatile cryptocurrency landscape. The coming days will be decisive in determining whether the sweep was a bear trap or a confirmation of continued downside momentum.
FAQs
Q1: What does ‘sweeping liquidity’ mean in cryptocurrency trading?
A liquidity sweep is a price movement that intentionally runs through a concentrated area of stop-loss orders or pending orders (liquidity) before reversing. It is a common market phenomenon where large players trigger these clustered orders to obtain better prices or to induce volatility.
Q2: Why is the $1,962 level so important for Ethereum right now?
The $1,962 level represents a prior swing high and a key Fibonacci retracement level. A break above it would create a higher high on the daily chart, breaking the sequence of lower highs that defines the current short-term downtrend, signaling a potential trend change.
Q3: What are ‘long liquidations’ and how do they affect the market?
Long liquidations occur when traders who have bet on the price rising (long positions) using borrowed funds (leverage) are forced to sell their positions because the price has fallen to a level where their collateral is insufficient. This forced selling can exacerbate downward price moves in the short term but can also remove excess leverage from the system.
Q4: How does on-chain data support or contradict this technical price analysis?
On-chain data, such as declining exchange balances and a growing number of non-zero addresses, suggests a trend of accumulation and holding among Ethereum investors. This fundamental strength can provide underlying support, even if technicals appear bearish in the short term, indicating a potential divergence.
Q5: What is the most important level for Ethereum to hold to avoid further downside?
The most immediate and critical support level to watch is the local low at $1,846. A sustained break and daily close below this level would likely trigger further selling pressure, with the next major support zone existing between $1,750 and $1,800.