Bitcoin Price Hits $64K: Why Cautious Smart Money Awaits Critical Liquidity Confirmation
Bitcoin’s price reached $64,000 in early 2025 trading, yet sophisticated institutional investors and professional traders maintain a surprisingly cautious stance. Market data reveals that despite the cryptocurrency’s recovery into the $63,000 to $64,000 zone, significant capital remains on the sidelines awaiting critical technical confirmations. This divergence between price action and professional positioning offers valuable insights into current market dynamics and potential future movements.
Bitcoin Price Action and Professional Trader Response
Bitcoin currently trades at approximately $64,000 after briefly touching $63,500 earlier this week. This price movement represents a recovery from Monday’s lows, yet professional trading desks report limited long positioning. Market analysts observe that the recent price action completed what traders call a “liquidity sweep”—a technical pattern where price briefly moves beyond key levels to trigger stop-loss orders before reversing direction. Consequently, many institutional traders await additional confirmation signals before committing substantial capital to long positions.
Historical data shows similar patterns during previous Bitcoin cycles. For instance, during the 2021 bull market, professional traders frequently waited for multiple confirmations before entering positions despite seemingly favorable price movements. This disciplined approach often distinguishes institutional trading strategies from retail investor behavior. Market structure analysis indicates that the current hesitation stems from several technical and fundamental factors requiring resolution.
Liquidity Dynamics and Market Structure Analysis
Liquidity represents a crucial concept in cryptocurrency markets, referring to the availability of buy and sell orders at various price levels. Professional traders monitor liquidity distribution to identify potential support and resistance zones. The recent sweep of the $63,500 level removed significant sell-side liquidity, potentially creating conditions for upward movement. However, traders now seek confirmation that sufficient buy-side liquidity exists to sustain higher prices.
Market microstructure analysis reveals three key liquidity considerations currently influencing professional trading decisions:
- Order Book Depth: The concentration of buy and sell orders near current price levels
- Exchange Liquidity: Available trading volume across major cryptocurrency exchanges
- Derivatives Market Impact: How futures and options positions affect spot market liquidity
Data from major exchanges shows that while spot market liquidity has improved compared to 2024 levels, it remains below previous bull market peaks. This relative thinness contributes to increased price volatility and professional trader caution.
Derivatives Market Signals and Confirmation Requirements
Cryptocurrency derivatives markets provide essential signals for professional traders. Futures and options data offer insights into market sentiment, leverage levels, and potential price inflection points. Current derivatives metrics show mixed signals that contribute to the cautious professional stance.
The table below summarizes key derivatives indicators as of early 2025:
| Indicator | Current Reading | Professional Interpretation |
|---|---|---|
| Funding Rates | Moderately Positive | Neutral to slightly bullish sentiment |
| Open Interest | Increasing gradually | Growing market participation |
| Put/Call Ratio | Balanced | No extreme fear or greed detected |
| Liquidations Heatmap | Clustered near $62K and $66K | Potential volatility zones identified |
Professional trading desks typically require multiple confirming signals from derivatives markets before establishing substantial positions. Currently, while some indicators appear favorable, others suggest the need for additional confirmation. This systematic approach helps institutional investors manage risk in volatile cryptocurrency markets.
Institutional Investment Patterns and Historical Context
Institutional investment in Bitcoin has evolved significantly since 2020. Major financial institutions now participate through various vehicles including exchange-traded funds, direct holdings, and structured products. Analysis of institutional flow data reveals that professional investors often exhibit different timing patterns compared to retail participants. Specifically, institutions frequently enter positions after initial price movements have established clear technical foundations.
Recent blockchain analytics show that addresses associated with institutional investors have been accumulating Bitcoin gradually rather than making large, immediate purchases at current levels. This accumulation pattern suggests a measured approach to position building rather than speculative trading. Furthermore, regulatory developments in major markets continue to influence institutional participation timelines and strategies.
Market observers note that institutional caution often precedes significant market movements. Historical analysis indicates that when professional traders eventually commit capital after receiving their required confirmations, the resulting flows can accelerate price trends. This pattern creates interesting dynamics where retail enthusiasm and professional caution temporarily diverge before potentially converging.
Technical Analysis and Key Level Monitoring
Technical analysis provides the framework for many professional trading decisions. Chart patterns, moving averages, and volume analysis help traders identify potential entry and exit points. Currently, technical analysts focus on several key levels that could trigger increased professional participation.
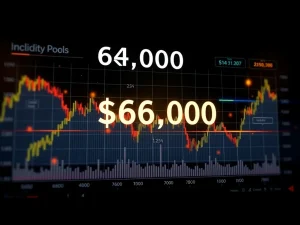
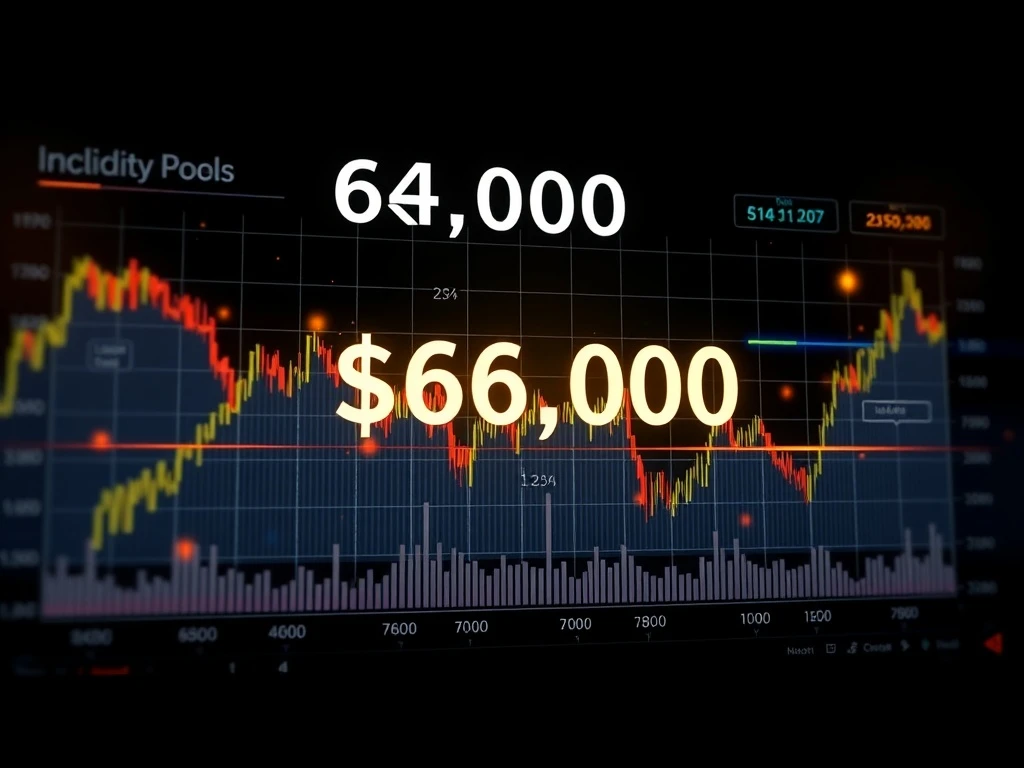
The $63,500 level recently served as both support and a liquidity sweep target. A sustained hold above this level would represent the first technical confirmation many traders seek. Additionally, the $65,000 to $66,000 zone represents the next significant resistance area where previous price action encountered selling pressure. Volume analysis shows increasing activity as price approaches these levels, suggesting growing market interest.
Moving average convergence divergence (MACD) indicators currently show neutral to slightly bullish signals on daily timeframes. However, professional traders typically require confirmation across multiple timeframes before establishing positions. This multi-timeframe analysis approach helps filter out noise and identify higher-probability trading opportunities.
Market Psychology and Sentiment Indicators
Market psychology plays a crucial role in cryptocurrency price movements. Sentiment indicators help professional traders gauge market extremes that often precede reversals. Current sentiment data shows a mixed picture that contributes to professional caution.
The Crypto Fear and Greed Index, a popular sentiment metric, currently registers in neutral territory. This balanced reading suggests neither extreme fear nor excessive greed dominates market psychology. Social media analysis reveals divided opinions about near-term price direction, with no clear consensus emerging. This lack of extreme sentiment typically encourages professional traders to await clearer signals before committing capital.
On-chain analytics provide additional psychological insights. Network activity metrics show steady but not explosive growth in new addresses and transaction volumes. This gradual expansion suggests organic network growth rather than speculative frenzy. Such conditions often support sustainable price appreciation but may not trigger immediate aggressive positioning from professional traders seeking momentum confirmation.
Regulatory Environment and Macroeconomic Factors
The regulatory landscape for cryptocurrencies continues to evolve in 2025. Recent developments in major jurisdictions have created both opportunities and uncertainties for institutional investors. Clear regulatory frameworks typically encourage institutional participation, while regulatory uncertainty often prompts caution.
Macroeconomic conditions also influence professional trading decisions. Interest rate policies, inflation data, and traditional market correlations all factor into institutional cryptocurrency allocation decisions. Current macroeconomic analysis suggests mixed conditions that neither strongly encourage nor discourage cryptocurrency investment from a macro perspective.
Geopolitical developments additionally impact cryptocurrency markets as digital assets increasingly serve as alternative investments during periods of traditional market stress or currency instability. Professional traders monitor these factors alongside technical and on-chain indicators when making allocation decisions.
Conclusion
Bitcoin’s price at $64,000 represents an important technical level that has attracted market attention. However, professional traders and institutional investors await additional confirmations before establishing substantial long positions. Liquidity dynamics, derivatives market signals, technical levels, and regulatory developments all contribute to this cautious approach. Market participants should monitor these factors closely as they may signal when professional capital enters the market more aggressively. The current divergence between price action and professional positioning offers valuable insights into sophisticated market participant psychology and risk management approaches in evolving cryptocurrency markets.
FAQs
Q1: What is a liquidity sweep in cryptocurrency trading?
A liquidity sweep occurs when price briefly moves beyond a key level to trigger stop-loss orders before reversing direction. Professional traders watch for these patterns as they often precede sustained price movements.
Q2: Why do professional traders wait for derivatives confirmation?
Derivatives markets provide insights into leverage, sentiment, and potential price inflection points. Confirmation from multiple derivatives indicators helps professional traders manage risk in volatile markets.
Q3: How does institutional Bitcoin investment differ from retail trading?
Institutional investors typically use systematic approaches, risk management frameworks, and longer time horizons. They often enter positions after technical foundations are established rather than during initial price movements.
Q4: What technical levels are professional traders currently monitoring?
Traders focus on the $63,500 support level and the $65,000 to $66,000 resistance zone. Sustained movement above or below these levels could trigger increased professional participation.
Q5: How does market sentiment affect professional trading decisions?
Professional traders monitor sentiment extremes that often precede market reversals. Current neutral sentiment encourages caution rather than aggressive positioning in either direction.