BNB Undervaluation Sparks Critical Analysis: Technical Signals Reveal Potential Turning Point
Global cryptocurrency markets witnessed a significant development this week as Binance Coin (BNB) entered what analysts describe as a historic undervaluation zone. The asset currently trades approximately 37% below its short-term holder realized price, a level that has historically preceded substantial recoveries. This situation presents a critical juncture for investors and market observers monitoring the broader blockchain ecosystem.
BNB Undervaluation: Technical Breakdown and Market Context
Market data from multiple cryptocurrency exchanges reveals BNB’s current position relative to key technical metrics. The short-term holder realized price represents the average acquisition cost for investors who purchased BNB within recent months. When an asset trades significantly below this level, it often indicates widespread unrealized losses among recent buyers. Historically, such conditions have created potential buying opportunities for long-term investors.
Several factors contribute to this undervaluation scenario. First, broader market sentiment across cryptocurrency sectors has remained cautious throughout recent trading sessions. Second, regulatory developments and exchange dynamics have influenced investor behavior. Third, technical indicators now suggest potential exhaustion of the current downward momentum.
Key Technical Indicators Analysis
Two primary technical tools provide insight into BNB’s current market position:
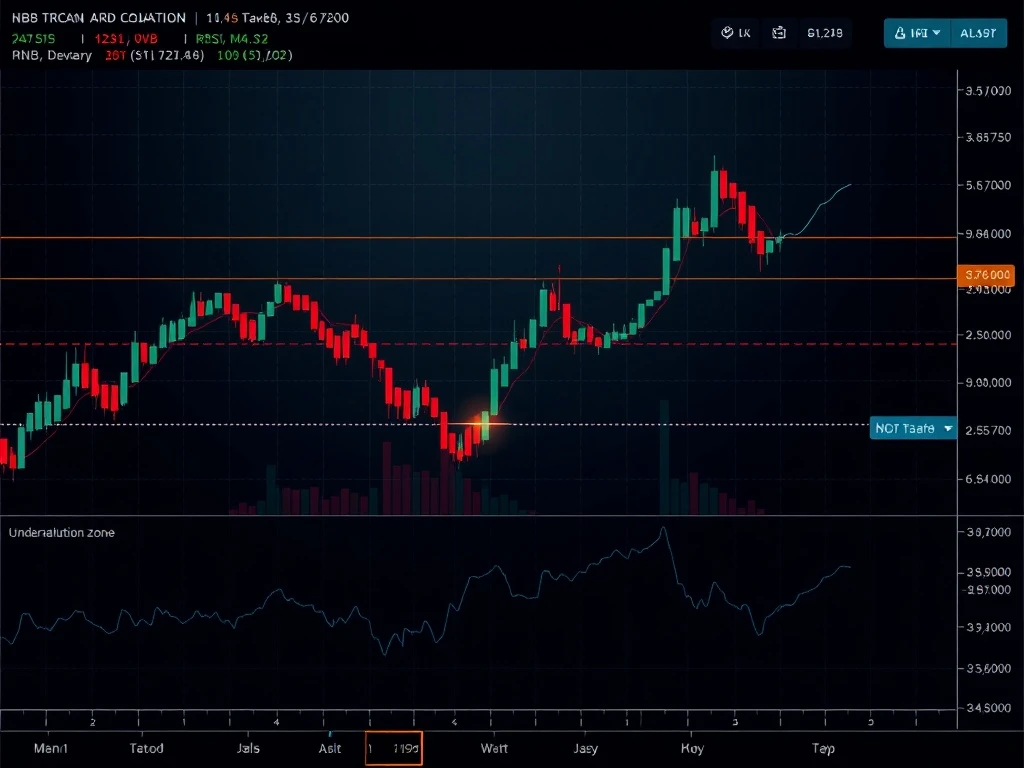
- Relative Strength Index (RSI): Currently at 35.62, this momentum oscillator approaches oversold territory. Values below 30 typically indicate oversold conditions that may precede price reversals.
- Moving Average Convergence Divergence (MACD): The histogram component shows shrinking bearish momentum, suggesting potential weakening of the current downtrend.
| Indicator | Current Value | Significance |
|---|---|---|
| Price vs. STH Realized Price | -37% | Historic undervaluation zone |
| Weekly RSI | 35.62 | Approaching oversold conditions |
| MACD Histogram | Shrinking | Potential trend exhaustion |
| Critical Support | $587 | Key weekly level to monitor |
Historical Precedents and Market Psychology
Previous instances where BNB traded significantly below its short-term holder realized price provide valuable context for current market conditions. Analysis of historical price action reveals three notable recovery periods following similar undervaluation signals. Each instance featured distinct market dynamics but shared common technical characteristics.
Market psychology plays a crucial role during these periods. When assets reach extreme undervaluation levels, several behavioral patterns typically emerge. First, retail investor sentiment often reaches pessimistic extremes. Second, institutional interest may increase as assets approach historically attractive valuation levels. Third, trading volume patterns frequently change as market participants reposition.
Support Level Analysis and Risk Management
The $587 weekly support level represents a critical technical threshold for BNB. This price point has demonstrated historical significance during previous market cycles. Market analysts emphasize several factors regarding this support level:
- Multiple previous tests have established its reliability
- Breakdown below this level could trigger additional selling pressure
- Successful defense often precedes substantial recovery movements
- Volume analysis provides confirmation of support strength
Risk management considerations remain paramount during such market conditions. Investors typically monitor several additional factors beyond price levels. Exchange reserves, network activity, and broader cryptocurrency market correlations all contribute to comprehensive risk assessment.
Broader Cryptocurrency Market Implications
BNB’s current technical situation occurs within a specific market context. The broader cryptocurrency sector has experienced increased volatility throughout recent trading periods. Several interconnected factors influence this environment. Regulatory developments across multiple jurisdictions continue to shape market sentiment. Additionally, macroeconomic conditions affect digital asset valuations alongside traditional financial markets.
Exchange token dynamics present another relevant consideration. BNB’s performance often correlates with platform activity and user adoption metrics. Recent developments in decentralized finance and blockchain infrastructure projects may influence long-term valuation fundamentals. These factors combine with technical indicators to create a complex analytical picture.
Expert Perspectives and Analytical Methodology
Financial analysts employ multiple methodologies when assessing cryptocurrency valuations. Technical analysis represents one component of comprehensive evaluation. Fundamental factors including network utility, adoption metrics, and ecosystem development provide additional context. Quantitative models incorporating both approaches often yield more robust insights than single-method analysis.
Market participants should consider several analytical principles during such conditions. First, confirmation from multiple indicators strengthens technical signals. Second, time frame alignment ensures consistent analysis. Third, risk management should precede profit potential in decision frameworks. These principles help navigate complex market environments.
Conclusion
BNB’s entry into a historic undervaluation zone presents a significant development for cryptocurrency markets. Technical indicators including RSI and MACD suggest potential exhaustion of the current downtrend. The $587 weekly support level represents a critical threshold for monitoring price action. Historical precedents indicate that similar conditions have sometimes preceded substantial recoveries. Market participants should consider multiple analytical perspectives while maintaining appropriate risk management protocols during this technically significant period for BNB valuation.
FAQs
Q1: What does “short-term holder realized price” mean?
This metric represents the average purchase price for investors who acquired BNB within approximately the last six months. When current price trades below this level, recent buyers face unrealized losses.
Q2: How significant is the RSI reading of 35.62?
The Relative Strength Index measures momentum on a scale from 0-100. Readings below 30 typically indicate oversold conditions that may precede price reversals, making 35.62 noteworthy but not extreme.
Q3: What happens if BNB breaks below $587 support?
A confirmed breakdown below this weekly support level could trigger additional selling pressure and potentially establish new resistance levels. Technical analysts would monitor volume and duration of any breakdown.
Q4: How reliable are historical precedents for cryptocurrency recovery?
While historical patterns provide context, cryptocurrency markets evolve rapidly. Past performance never guarantees future results, making comprehensive analysis essential.
Q5: What time frame should investors consider for this analysis?
The discussed indicators primarily reference weekly charts, suggesting intermediate-term significance. Shorter and longer time frames may present different technical pictures requiring separate analysis.