Bitcoin Selloff Reveals Stunning Structural Shift From Historical Crash Patterns
Global cryptocurrency markets witnessed a significant Bitcoin selloff throughout late 2024 and early 2025, yet emerging data reveals this downturn exhibits fundamentally different characteristics from previous bear cycles. While Bitcoin experienced a roughly 47% decline from its October 2025 peak, structural metrics and on-chain analysis indicate a maturation in market behavior that diverges sharply from patterns observed in 2011, 2014, and 2018. This analysis examines the compelling evidence suggesting why current market conditions represent an evolutionary shift in Bitcoin’s economic resilience.
Bitcoin Selloff Patterns Show Declining Maximum Drawdowns
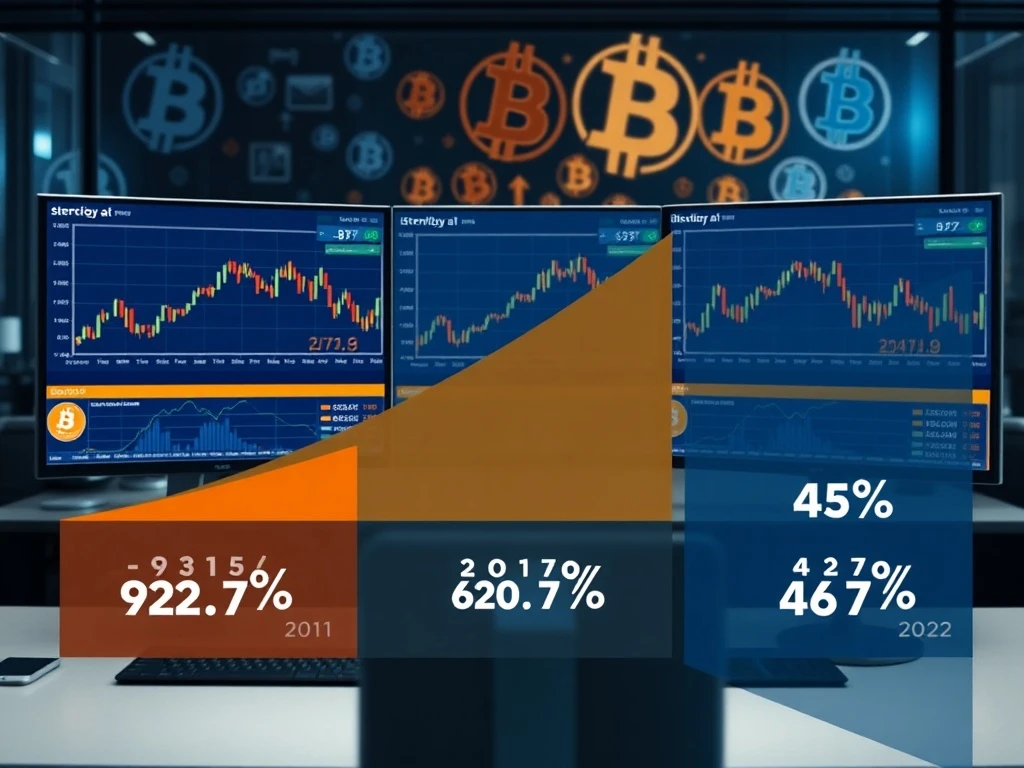
Historical Bitcoin cycles demonstrate a clear trend of decreasing maximum drawdown percentages over time. The 2011 bear market saw Bitcoin collapse by 92.7% from its peak, representing the most severe correction in cryptocurrency history. Subsequently, the 2014 cycle produced an 86.2% drawdown, followed by an 83.6% decline in 2018. Notably, the 2022 cycle recorded just a 68.5% maximum drawdown, while current data suggests the 2025 correction may not exceed 50%. This compression in drawdown magnitude signals increasing market stability and reduced volatility extremes.
Several structural factors contribute to this evolving pattern. First, institutional adoption has created more diversified holding patterns. Second, regulatory frameworks provide clearer operational guidelines. Third, derivative markets offer sophisticated hedging instruments. Fourth, improved infrastructure supports larger transaction volumes. Consequently, Bitcoin markets demonstrate greater resilience during downturns despite maintaining significant volatility relative to traditional assets.
Comparative Analysis of Historical Bitcoin Drawdowns
The following table illustrates the declining severity of Bitcoin bear markets across major cycles:
| Cycle Peak Year | Maximum Drawdown Percentage | Duration (Months) | Key Market Characteristics |
|---|---|---|---|
| 2011 | -92.7% | 11 | Retail-dominated, minimal infrastructure |
| 2014 | -86.2% | 17 | Mt. Gox collapse, early exchanges |
| 2018 | -83.6% | 15 | ICO boom and bust, regulatory uncertainty |
| 2022 | -68.5% | 14 | Institutional entry, macro pressures |
| 2025 | ~-47% (projected) | Ongoing | ETF integration, structural maturity |
Demand Metrics Reveal Fundamental Divergence
On-chain data provides compelling evidence that the 2025 Bitcoin selloff differs fundamentally from previous cycles. Network analysis shows Bitcoin demand flipped to positive territory at +1,200 BTC after bottoming near -154,000 BTC in December 2024. This rapid demand recovery contrasts sharply with the prolonged negative demand periods observed during previous bear markets. Specifically, the 2018 cycle maintained negative demand metrics for approximately nine consecutive months, while the current cycle witnessed demand normalization within just three months of the December 2024 low.
Market analysts attribute this accelerated recovery to several structural changes. Spot Bitcoin exchange-traded funds (ETFs) now provide regulated exposure for institutional investors. Additionally, corporate treasury allocations create consistent baseline demand. Furthermore, improved custody solutions reduce security concerns. Meanwhile, developing nation adoption introduces new demand sources. These factors collectively create more stable demand fundamentals despite price volatility.
Expert Analysis of Current Market Structure
Financial analysts specializing in cryptocurrency markets identify three key structural differences in the current Bitcoin selloff. First, derivative market positioning shows less extreme leverage compared to previous cycles. Second, exchange reserves indicate stronger holder conviction during price declines. Third, network activity demonstrates sustained utility beyond speculative trading. Consequently, these metrics suggest a more mature market ecosystem capable of absorbing selling pressure without triggering cascading liquidations.
Blockchain analytics firms report that long-term holder supply reached new highs during the 2025 downturn, contrasting with significant distribution during the 2018 cycle. This behavioral shift indicates growing conviction among Bitcoin investors, who increasingly view temporary price declines as accumulation opportunities rather than exit signals. Additionally, miner capitulation metrics show less extreme stress compared to previous cycles, suggesting improved operational resilience across the network.
Sentiment Indicators Contrast With Structural Reality
The Bitcoin Fear and Greed Index registered single-digit readings during the 2025 selloff, typically indicating extreme fear similar to previous market bottoms. However, structural data reveals significant divergence between sentiment indicators and fundamental metrics. While sentiment reached pessimistic extremes comparable to 2018 levels, on-chain activity, network security, and institutional flows maintained relative strength. This disconnect suggests sentiment indicators may become less reliable as markets mature and participant sophistication increases.
Market participants should consider several contextual factors when interpreting sentiment data. First, increased media coverage amplifies emotional responses to price movements. Second, social media algorithms prioritize extreme content. Third, derivative market positioning influences short-term sentiment disproportionately. Fourth, regulatory developments create uncertainty beyond price considerations. Therefore, investors must analyze multiple data dimensions rather than relying solely on sentiment indicators.
Macroeconomic Context and Bitcoin Performance
The 2025 Bitcoin selloff occurred within a complex macroeconomic environment characterized by persistent inflation concerns, geopolitical tensions, and shifting monetary policies. Unlike previous cycles where Bitcoin often moved independently from traditional markets, recent correlations with technology stocks and inflation hedges have increased. This integration with broader financial markets represents both a maturation milestone and a new vulnerability vector, as Bitcoin now responds to macroeconomic forces previously less influential on cryptocurrency prices.
Central bank policies particularly impact current market dynamics. Interest rate decisions influence opportunity costs for holding non-yielding assets like Bitcoin. Additionally, fiscal stimulus measures affect inflation expectations and store-of-value demand. Meanwhile, currency volatility in emerging markets drives alternative asset adoption. These interconnected factors create a more complex analytical framework for understanding Bitcoin price movements compared to earlier cycles dominated primarily by internal cryptocurrency market dynamics.
Technological Developments Supporting Market Resilience
Bitcoin’s underlying technology and ecosystem improvements contribute significantly to the differentiated nature of the 2025 selloff. The Lightning Network now processes substantial transaction volume, demonstrating real-world utility beyond speculative trading. Additionally, Taproot implementation enhances privacy and smart contract capabilities. Furthermore, institutional-grade custody solutions reduce security concerns that previously hampered large-scale adoption. These technological advancements create fundamental value independent of price speculation.
Network security metrics provide particularly compelling evidence of ecosystem strength. Bitcoin’s hash rate maintained near all-time highs throughout the 2025 selloff, indicating robust miner commitment despite price declines. This contrasts with previous cycles where hash rate often declined proportionally with price. The decoupling of security investment from short-term price action suggests miners increasingly view Bitcoin mining as a long-term infrastructure investment rather than purely price-dependent profitability calculation.
Conclusion
The 2025 Bitcoin selloff demonstrates fundamentally different characteristics from previous bear cycles, signaling market maturation and structural evolution. Declining maximum drawdown percentages, accelerated demand recovery, and sustained network fundamentals collectively indicate growing resilience despite ongoing volatility. While the Bitcoin selloff generated significant price declines and extreme fear sentiment, underlying metrics reveal a market transitioning from speculative infancy toward financial infrastructure maturity. Investors should recognize these structural shifts when evaluating risk and opportunity in evolving cryptocurrency markets.
FAQs
Q1: How does the 2025 Bitcoin selloff compare to the 2018 bear market?
The 2025 selloff shows approximately 47% decline from peak compared to 83.6% in 2018, with faster demand recovery, stronger network fundamentals, and more institutional participation distinguishing current conditions.
Q2: What metrics indicate Bitcoin demand has recovered during the 2025 selloff?
On-chain data shows Bitcoin demand flipped from -154,000 BTC in December 2024 to +1,200 BTC, with exchange outflows, increased accumulation addresses, and positive ETF flows confirming demand recovery.
Q3: Why are maximum Bitcoin drawdowns decreasing over time?
Declining drawdowns result from institutional adoption, improved market infrastructure, regulatory clarity, derivative hedging instruments, and diversified global participation creating more stable market structure.
Q4: How reliable are sentiment indicators like the Fear and Greed Index during current market conditions?
While still useful, sentiment indicators show increasing divergence from structural fundamentals as markets mature, requiring additional on-chain and institutional flow data for comprehensive analysis.
Q5: What role do Bitcoin ETFs play in the current market structure?
Spot Bitcoin ETFs provide regulated institutional access, create consistent baseline demand, improve price discovery mechanisms, and reduce barriers to entry compared to previous cycles.