Solana Price Faces Critical Test: Breaking Support Trendline Sparks Major Correction Fears
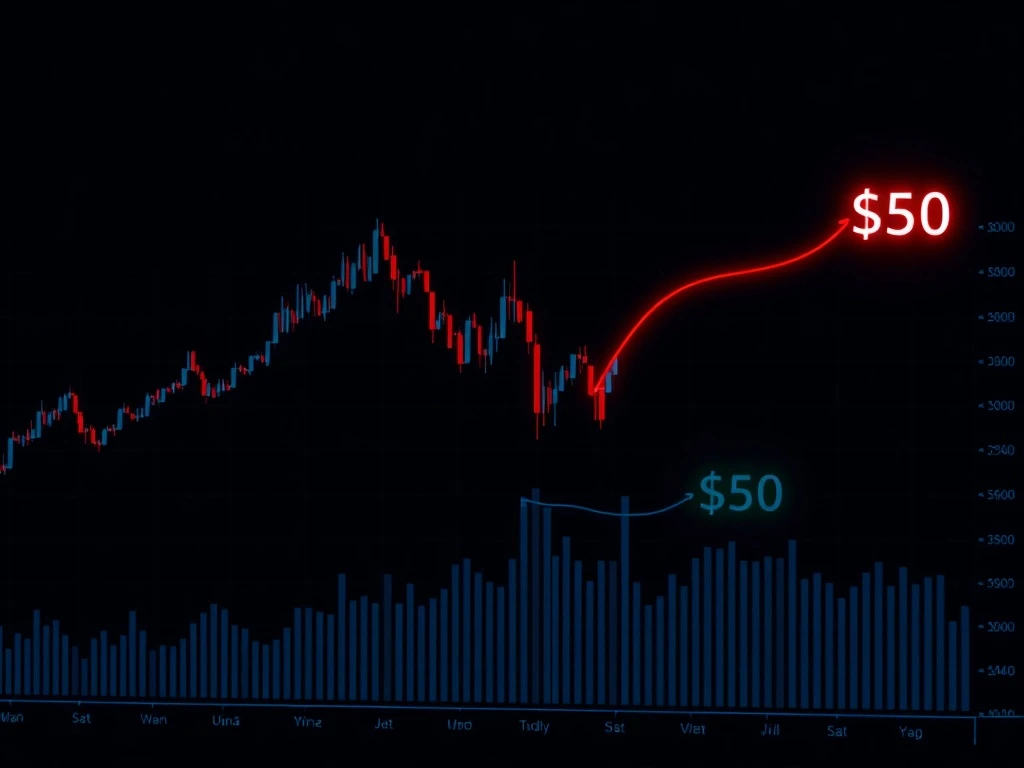
Global cryptocurrency markets entered a period of heightened volatility this week, with Solana (SOL) facing a pivotal technical test. The digital asset’s price action broke a critical three-day support trendline, a development that analysts now warn could precipitate a significant correction. This breach places immediate focus on the $74 and $50 price levels as key zones that will determine the near-term trajectory for one of the market’s most prominent altcoins. The move comes amidst broader macroeconomic uncertainty and shifting liquidity conditions across digital asset markets.
Solana Price Breach: Analyzing the Technical Breakdown
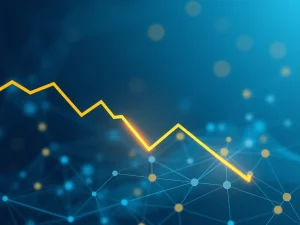
The recent price action for Solana represents a clear shift in market structure. Technical analysts monitor support trendlines to gauge the strength of bullish momentum. A sustained break below such a level, especially one established over a multi-day timeframe, often signals weakening buyer conviction. Consequently, this event transitions the market narrative from one of accumulation to potential distribution.
Market data from major exchanges confirms the breakdown occurred on elevated volume, adding credence to the move’s significance. The three-day chart timeframe is particularly noteworthy for institutional and swing traders, making this breach a high-convidence signal for many participants. Historical precedent shows that similar breaks in other major cryptocurrencies have frequently led to extended corrective phases.
| Key Technical Level | Significance | Historical Context |
|---|---|---|
| $74 Support | Immediate horizontal support & previous consolidation zone | Acted as strong resistance in Q4 2023 before breakthrough |
| $50 Support | Major psychological and technical support zone | Base for the major rally initiation in late 2023 |
| Broken Trendline | Dynamic support governing the recent uptrend | Held for approximately 18 trading sessions prior to break |
Volatility and Momentum: The Broader Market Context
Solana’s technical predicament does not exist in a vacuum. Broader cryptocurrency market volatility has increased measurably over the past fortnight. Several interconnected factors contribute to this environment. First, shifting expectations regarding global interest rate policies impact liquidity perceptions for risk assets like cryptocurrencies. Second, network-specific developments, including updates to Solana’s protocol and congestion solutions, influence investor sentiment.
Furthermore, the correlation between Bitcoin’s price action and major altcoins like Solana remains significant. When Bitcoin experiences directional uncertainty or selling pressure, capital often flows out of altcoins at an accelerated rate, exacerbating downward moves. This high-beta relationship means Solana’s price can be more volatile during market-wide corrections.
- Liquidity Conditions: Tighter monetary policy rhetoric from central banks can reduce speculative capital.
- On-Chain Metrics: Shifts in network activity, staking yields, and developer engagement provide fundamental context.
- Derivatives Market: High funding rates and open interest can precede sharp corrections as leveraged positions unwind.
Expert Analysis on Critical Price Levels
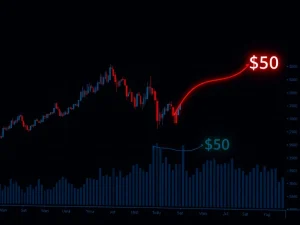
Market strategists emphasize the importance of the $74 and $50 levels. Maria Chen, a senior technical analyst at Digital Asset Research, notes, “The $74 zone represents more than just a number on a chart. It’s a confluence area where we saw significant volume profile and a prior resistance-turned-support. A decisive close below this on a daily timeframe would open the path toward testing the more substantial $50 region.” This perspective is echoed by institutional reports that highlight these levels as major value areas for long-term holders.
Historical volatility analysis for Solana shows it typically experiences sharper drawdowns but also more vigorous recoveries than the broader crypto market average. This characteristic underscores why the current test of support is critical. A failure to hold could trigger automated selling from algorithmic trading systems and risk-management protocols, potentially accelerating the move downward.
The Path Forward: Scenarios and Market Implications
The immediate future for Solana’s price hinges on its ability to reclaim the broken trendline or establish new support. Two primary scenarios emerge from current analysis. In a bullish resolution, price would need to recover above the trendline swiftly, demonstrating the break was a false signal or bear trap. This would require a significant influx of buying volume, likely tied to a positive catalyst like a major network upgrade or partnership announcement.
The alternative, more cautious scenario involves a continued descent toward the $74 level. If that zone fails to attract sufficient buying interest, the focus shifts squarely to the $50 support area. A retest of $50 would represent a substantial correction from recent highs but could also establish a durable base for the next market cycle. Market depth data from order books will be a key real-time indicator to watch for signs of institutional accumulation at these lower levels.
Conclusion
The Solana price faces a definitive technical moment after breaking its critical three-day support trendline. This development elevates the importance of the $74 and $50 support levels as battlegrounds for market direction. While the break introduces clear correction risks, it also occurs within the context of Solana’s historically volatile and innovative ecosystem. Market participants should monitor volume, broader crypto market sentiment, and on-chain fundamentals alongside price action. The coming sessions will test the resilience of the current bullish thesis for SOL and provide critical data on investor conviction in a maturing digital asset landscape.
FAQs
Q1: What does “breaking a support trendline” mean for Solana’s price?
A break below a support trendline indicates that the prior pattern of higher lows has been invalidated. This is a technical signal that selling pressure has overcome buying pressure at a key dynamic level, often leading to further downside as stop-loss orders are triggered and momentum shifts.
Q2: Why are the $74 and $50 price levels specifically important?
These levels are identified as major areas of historical trading activity and psychological significance. $74 was a previous resistance zone that turned into support, while $50 represents a deeper, long-term support base from which previous major rallies originated. They are watched as potential areas where buyers may re-enter the market.
Q3: How does Bitcoin’s price action affect Solana during this correction risk?
Solana, like most major altcoins, has a high correlation with Bitcoin. During periods of Bitcoin weakness or uncertainty, capital tends to flow out of riskier altcoins first, often magnifying Solana’s downward moves. A stable or rising Bitcoin price can help cushion Solana’s fall.
Q4: What on-chain metrics should investors watch alongside the price?
Key metrics include network transaction volume, active wallet addresses, total value locked (TVL) in Solana’s DeFi ecosystem, and staking participation rates. Stable or growing fundamentals can provide confidence that a price correction is technical rather than fundamental.
Q5: Could this price action be a “bear trap” or false breakdown?
Yes, false breakdowns are common in volatile markets. For the break to be considered a bear trap, price would need to reclaim the trendline convincingly with strong volume quickly, suggesting the initial move down was a liquidity grab before a resumption of the uptrend.