Injective (INJ) at $3: Critical Analysis of Reversal Signals Versus Breakdown Fears
Global cryptocurrency markets face pivotal moments as Injective (INJ), the native token of the decentralized exchange protocol, tests crucial support near $3.27 following a substantial 76% decline from its 2024 highs above $40. This price level represents a significant technical and psychological threshold for traders and investors monitoring the blockchain sector’s evolving landscape. Market analysts now scrutinize whether current conditions signal potential reversal opportunities or indicate further downward pressure for the specialized decentralized finance asset.
Injective (INJ) Technical Analysis and Market Context
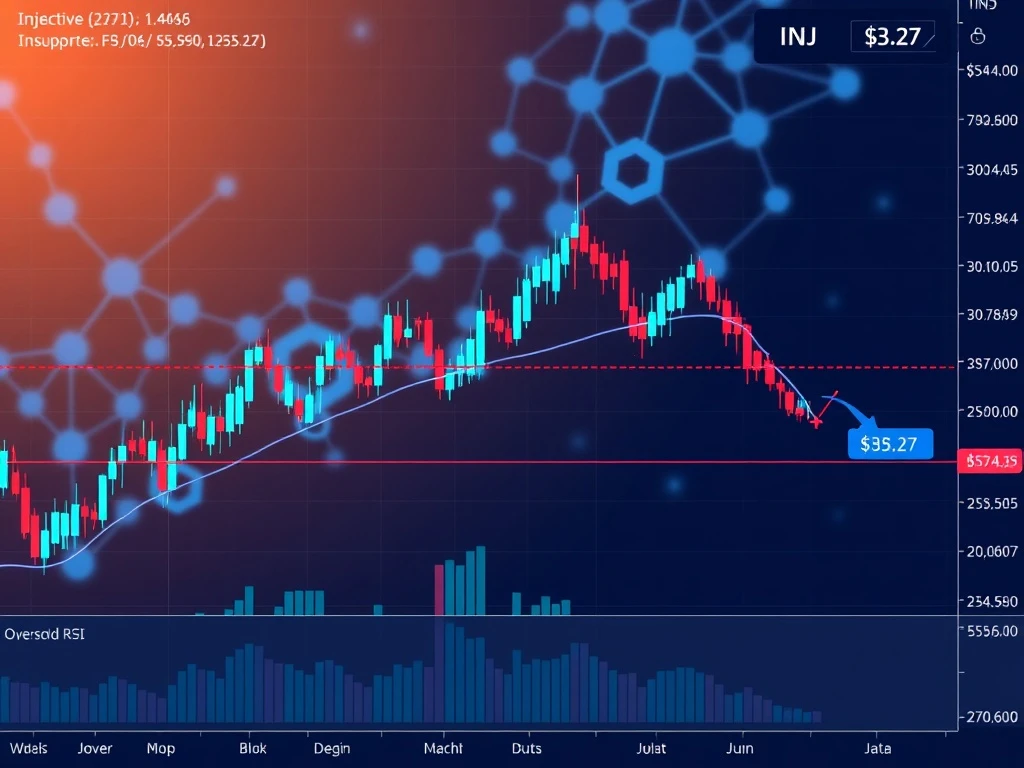
Weekly chart analysis reveals Injective trading at approximately $3.27, representing a substantial departure from its previous valuation heights. The cryptocurrency market, particularly decentralized exchange tokens, experienced notable volatility throughout 2024. Consequently, Injective’s price trajectory reflects broader sector trends while maintaining unique characteristics tied to its specific protocol developments and adoption metrics. Technical indicators currently present conflicting signals that require careful interpretation.
Market data from multiple exchanges confirms sustained selling pressure across recent trading sessions. However, the Relative Strength Index (RSI) now registers oversold conditions on weekly timeframes. Historically, such RSI readings have preceded corrective rallies in various cryptocurrency assets. Nevertheless, fundamental factors including network activity, developer contributions, and competitive positioning significantly influence price discovery mechanisms for specialized blockchain tokens.
Historical Performance and Comparative Analysis
Injective’s price history demonstrates notable volatility patterns consistent with emerging blockchain infrastructure projects. The protocol launched its mainnet in November 2021, initially attracting attention for its novel approach to decentralized derivatives trading. Subsequently, the token achieved an all-time high exceeding $40 during the 2024 market cycle. Comparative analysis with similar decentralized exchange tokens reveals correlation during market-wide movements while displaying divergence based on protocol-specific developments.
The broader decentralized exchange sector expanded significantly throughout 2024, with total value locked across major protocols increasing approximately 47% year-over-year according to DeFiLlama data. Injective’s unique architecture, featuring built-in derivatives modules and cross-chain capabilities, positioned it within a competitive niche. Protocol development continued throughout the market downturn, with the core team implementing multiple network upgrades and partnership integrations.
Technical Indicators and Market Structure Examination
Weekly price structure analysis identifies several critical technical levels for Injective. The $3 support zone represents a convergence of historical accumulation areas and Fibonacci retracement levels from previous market cycles. Additionally, trading volume patterns show decreasing sell-side momentum near current levels, potentially indicating exhaustion among short-term traders. Several technical factors warrant consideration:
- Moving Average Convergence: The 50-week and 200-week moving averages maintain bearish alignment, suggesting persistent downward momentum on longer timeframes
- Volume Profile Analysis: Current trading occurs within a high-volume node established during previous accumulation phases
- Momentum Oscillators: Multiple momentum indicators including MACD and Stochastic RSI approach extreme oversold territories
- Support and Resistance Levels: Clear technical boundaries exist at $2.80 (support) and $4.50 (resistance) based on historical price action
Market structure on lower timeframes reveals consolidation patterns near the $3.20-$3.40 range. These patterns typically precede directional breaks, making current price action particularly significant for technical traders. Order book data from major exchanges shows substantial buy orders accumulating below $3, potentially establishing a floor for near-term price discovery.
Fundamental Protocol Developments and Ecosystem Growth
Beyond technical analysis, Injective’s fundamental developments provide essential context for price evaluation. The protocol implemented multiple significant upgrades throughout 2024, including enhanced cross-chain capabilities and improved derivatives modules. Developer activity metrics, tracked through GitHub repositories, remained consistent despite market conditions. Furthermore, the ecosystem expanded through strategic partnerships and integration with major blockchain infrastructure providers.
Network utilization metrics present a mixed picture. While daily active addresses declined approximately 34% from peak levels, transaction volume per user increased significantly. This suggests remaining participants engage more deeply with the protocol’s features. The decentralized exchange’s unique value proposition centers on permissionless derivatives trading, a sector projected to grow substantially as regulatory frameworks evolve.
Market Psychology and Trader Sentiment Analysis
Cryptocurrency market sentiment surrounding decentralized exchange tokens remains cautious yet selectively optimistic. Social media analysis reveals divided perspectives regarding Injective’s current valuation. Some traders emphasize the protocol’s technological advantages and development progress, while others highlight competitive pressures and broader market headwinds. Sentiment indicators derived from social platforms and trading forums show:
- Fear and Greed Index: Current readings suggest extreme fear across cryptocurrency markets
- Social Volume Metrics: Discussion frequency decreased 42% from 2024 peaks, indicating reduced retail attention
- Weighted Sentiment Analysis: Negative sentiment dominates recent discussions but shows signs of stabilization
- Development Activity: Consistent code commits and protocol improvements contrast with price depreciation
Institutional positioning data reveals nuanced approaches to decentralized exchange tokens. While some traditional finance entities reduced exposure throughout 2024, others established strategic positions at current levels. Regulatory developments significantly influence institutional participation, with clearer frameworks potentially catalyzing renewed interest in compliant decentralized finance protocols.
Comparative Sector Analysis and Competitive Positioning
Injective operates within the competitive decentralized exchange sector, facing established competitors and emerging alternatives. Comparative analysis reveals distinct architectural approaches and feature specializations across protocols. The derivatives-focused niche represents approximately 18% of total decentralized exchange volume according to recent industry reports. Injective’s cross-chain capabilities and customized blockchain architecture provide technical differentiation, though adoption metrics trail leading general-purpose decentralized exchanges.
The broader blockchain infrastructure sector continues evolving rapidly, with layer-2 solutions and alternative layer-1 networks implementing native decentralized exchange modules. This competitive landscape creates both challenges and opportunities for specialized protocols. Successful navigation requires continuous innovation, strategic partnerships, and community engagement—factors actively monitored by market participants evaluating long-term viability.
Risk Factors and Market Dynamics Considerations
Multiple risk factors influence Injective’s price trajectory and require objective assessment. Regulatory developments represent significant variables, particularly regarding derivatives trading and cross-chain operations. Additionally, macroeconomic conditions including interest rate policies and traditional market correlations impact cryptocurrency valuations. Protocol-specific risks include technological execution, competitive pressures, and adoption hurdles. Market participants typically evaluate:
- Regulatory Environment: Evolving global frameworks for decentralized finance and derivatives trading
- Technological Execution: Protocol upgrades, security audits, and network performance metrics
- Competitive Landscape: Feature development and market share dynamics within the decentralized exchange sector
- Market Liquidity: Trading volume patterns and exchange support for the INJ token
- Ecosystem Development: Application growth, partnership announcements, and community initiatives
Historical cryptocurrency market cycles demonstrate that periods of extreme price compression often precede significant directional moves. Current conditions reflect such compression, with volatility measures approaching yearly lows despite substantial price depreciation. This technical setup typically resolves through expanded volatility, making risk management particularly crucial for market participants.
Conclusion
Injective (INJ) faces a critical juncture near the $3 price level, balancing oversold technical conditions against persistent market pressures. The decentralized exchange token’s trajectory depends on multiple factors including protocol developments, sector dynamics, and broader cryptocurrency market trends. Technical analysis identifies potential reversal signals while acknowledging breakdown risks below key support levels. Market participants continue monitoring fundamental metrics alongside price action, recognizing that specialized blockchain assets require multifaceted evaluation approaches. The coming weeks will likely provide clearer directional signals as the market processes current information and responds to evolving conditions.
FAQs
Q1: What technical indicators suggest Injective (INJ) might be oversold?
The Relative Strength Index (RSI) shows oversold conditions on weekly charts, while momentum oscillators like MACD approach extreme levels. Additionally, trading volume patterns indicate potential selling exhaustion near current price levels.
Q2: How does Injective’s current price compare to its historical performance?
Injective trades approximately 92% below its all-time high above $40, representing a 76% decline from yearly highs. The current $3.27 level tests crucial support established during previous market cycles.
Q3: What fundamental factors differentiate Injective from other decentralized exchange tokens?
Injective specializes in decentralized derivatives trading with built-in modules, operates on its own blockchain rather than as a smart contract, and features cross-chain capabilities through IBC integration and bridges.
Q4: How has developer activity on the Injective protocol evolved during the market downturn?
GitHub metrics show consistent developer activity throughout 2024, with multiple protocol upgrades implemented despite market conditions. The core team continued shipping features including enhanced derivatives modules and cross-chain improvements.
Q5: What are the key support and resistance levels for Injective based on technical analysis?
Critical support exists near $2.80-$3.00 based on historical accumulation, while resistance levels appear at approximately $4.50 and $6.00. These technical boundaries help traders identify potential breakout or breakdown scenarios.