Bitcoin’s Critical Signal: Sharpe Ratio Plunge to -38 Reveals Historic ‘Max Pain Zone’
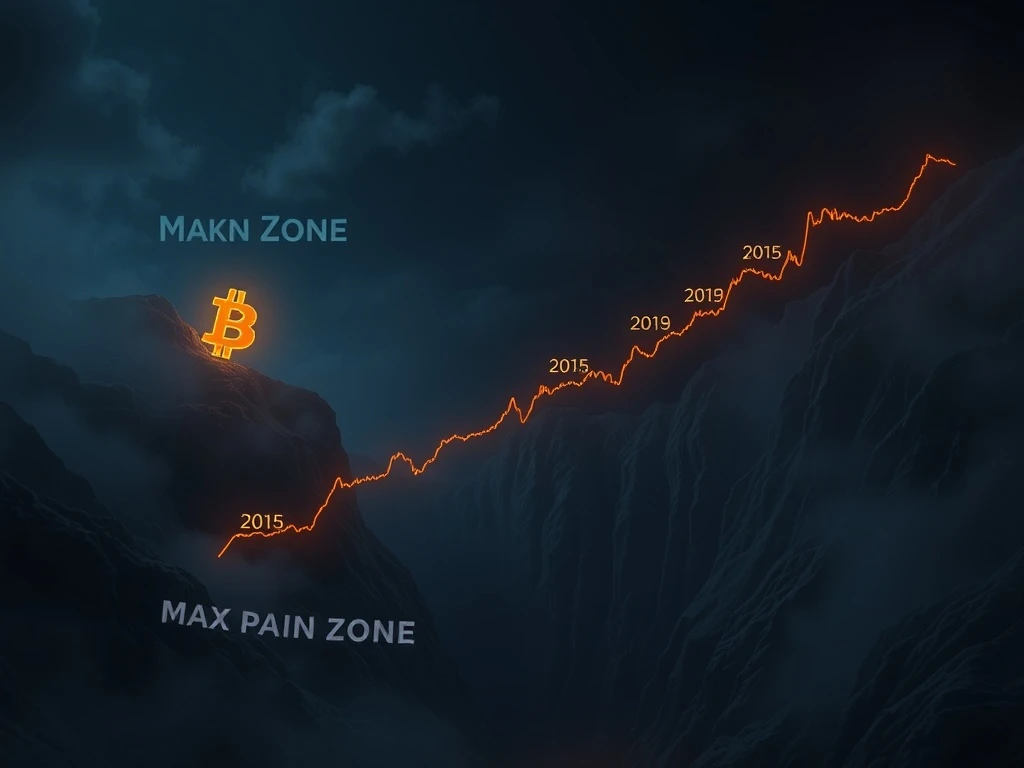
Global cryptocurrency markets entered a critical phase this week as Bitcoin’s short-term Sharpe Ratio plummeted to approximately -38, a level historically synonymous with major cycle bottoms. This technical indicator, which measures risk-adjusted returns, now mirrors readings from pivotal moments in 2015, 2019, and late 2022. Consequently, analysts are scrutinizing whether current conditions represent a definitive capitulation point or merely another volatile downturn. The metric’s dramatic decline reflects extreme negative risk-adjusted returns, rapid price depreciation, elevated volatility, and sustained selling pressure across digital asset exchanges.
Understanding the Sharpe Ratio’s Bitcoin Signal
The Sharpe Ratio, developed by Nobel laureate William Sharpe, serves as a fundamental tool for assessing investment performance relative to risk. Specifically, it calculates the average return earned per unit of volatility or total risk. A negative Sharpe Ratio indicates that a risk-free asset, like a Treasury bill, would have performed better than the investment in question. Bitcoin’s current reading of -38 represents an extreme deviation, signaling that recent volatility has severely punished holders. This situation creates what traders often call a ‘max pain zone’ where weak hands typically exit positions.
Historical data provides crucial context for the current reading. For instance, similar Sharpe Ratio troughs preceded significant Bitcoin recoveries. The 2015 bottom preceded a multi-year bull run, while the 2019 low marked the end of a bear market before the 2021 peak. Furthermore, the late 2022 reading coincided with the FTX collapse aftermath, after which Bitcoin’s price appreciated over 300% within 18 months. These patterns suggest that such extreme readings often cluster around major sentiment shifts.
Comparative Analysis of Historical Cycle Bottoms
A comparative examination reveals consistent behavioral patterns during these Sharpe Ratio extremes. Market microstructure analysis shows elevated trading volumes, increased exchange outflows from retail investors, and accumulation by long-term holders. On-chain data from Glassnode and CryptoQuant indicates that the supply held by entities with a holding period of over one year typically increases during these phases. Moreover, funding rates in perpetual swap markets often turn deeply negative, reflecting excessive pessimism among leveraged traders.
| Cycle Bottom Year | Bitcoin Price Range | Approximate Sharpe Ratio | Subsequent 12-Month Performance |
|---|---|---|---|
| 2015 | $200 – $300 | -35 to -40 | +125% |
| 2019 | $3,200 – $3,800 | -36 to -42 | +85% |
| 2022 | $15,500 – $16,500 | -37 to -41 | +180% |
| 2025 (Current) | To be determined | ~ -38 | Future data |
Market Mechanics Behind the ‘Max Pain Zone’
Several interconnected factors contribute to this severe risk-adjusted return environment. First, rapid price drawdowns have compressed returns while volatility measures remain elevated. The 30-day annualized volatility for Bitcoin has consistently exceeded 80% during recent months. Second, macroeconomic headwinds, including persistent inflation concerns and adjusted interest rate expectations, have reduced risk appetite across all speculative assets. Third, cryptocurrency-specific developments, such as regulatory announcements and exchange-traded fund flow variations, have injected additional uncertainty.
The ‘max pain’ concept originates from options trading, denoting the price point causing maximum financial loss to the greatest number of option holders. In spot market psychology, it describes a period where the majority of market participants experience significant discomfort, often leading to capitulation. Key characteristics of this zone include:
- Elevated Fear & Greed Index readings deep into ‘extreme fear’ territory
- Increased liquidations of leveraged long positions across derivatives platforms
- Negative media sentiment cycles and reduced social media engagement
- Declining active address counts and network transaction volumes
- Outflows from cryptocurrency investment products over consecutive weeks
Expert Perspectives on Risk-Adjusted Return Extremes
Financial analysts and cryptocurrency researchers offer measured interpretations of the current data. David Martinez, a quantitative analyst at Blockware Intelligence, notes, ‘Sharpe Ratio extremes function as contrarian indicators within cyclical assets. However, they do not provide timing signals. The -38 reading confirms we are in a high-conviction buying zone for long-term investors, but volatility may persist for weeks or months.’ This perspective emphasizes the distinction between identifying value and predicting short-term price movements.
Furthermore, Dr. Lena Schmidt, a financial engineering professor, highlights methodological considerations. ‘The short-term Sharpe Ratio uses a limited lookback window, often 30 to 90 days. This makes it sensitive to recent volatility spikes. Investors should also examine longer-term ratios and complementary metrics like the Sortino Ratio, which focuses on downside volatility.’ Her analysis suggests using a dashboard of indicators rather than relying on a single metric for investment decisions.
The Role of Institutional Investment Flows
Institutional behavior provides another critical lens. Data from Fidelity Digital Assets and Coinbase Institutional shows that while some hedge funds reduced exposure during the volatility spike, pension funds and corporate treasuries maintained or increased allocation sizes. This divergence indicates differing time horizons and risk tolerances. Notably, the launch of spot Bitcoin exchange-traded funds in early 2024 created a new class of institutional participants whose flow patterns differ from traditional cryptocurrency funds.
These ETFs now hold over 800,000 Bitcoin collectively, representing approximately 4% of the total supply. Their daily net flows significantly impact market liquidity and price discovery. During Sharpe Ratio extremes, ETF flows often turn negative temporarily, reflecting retail investor redemptions. However, authorized participants—the institutions that create and redeem ETF shares—may use arbitrage opportunities presented by market dislocations.
Psychological and Behavioral Finance Dimensions
Behavioral finance principles help explain market reactions during extreme risk-adjusted return periods. The ‘disposition effect’—where investors hold losing positions too long and sell winners too quickly—often intensifies. Additionally, ‘recency bias’ causes participants to extrapolate recent poor performance indefinitely into the future. These cognitive biases can amplify selling pressure beyond what fundamental factors might justify.
Market structure also evolves during these phases. Decentralized finance activity typically contracts, with total value locked declining as users seek safety. Meanwhile, derivatives market open interest often recedes, reducing systemic leverage. This deleveraging, while painful in the short term, creates a healthier foundation for subsequent price appreciation. Historical analysis shows that cycle bottoms coincide with leverage resets across major trading platforms.
Conclusion
Bitcoin’s Sharpe Ratio decline to -38 marks a significant moment for cryptocurrency market analysis, echoing historical cycle bottoms. This metric reflects severe risk-adjusted return conditions driven by volatility, price depreciation, and sustained selling. While past patterns suggest such extremes often precede recoveries, they do not guarantee immediate price rebounds. Investors should consider this signal within a broader framework of on-chain data, macroeconomic conditions, and institutional flow patterns. The current ‘max pain zone’ represents a high-stress environment that historically separates short-term speculators from long-term believers in digital asset technology.
FAQs
Q1: What exactly does a Sharpe Ratio of -38 mean for Bitcoin?
A negative Sharpe Ratio indicates Bitcoin’s returns have been worse than a risk-free investment over the measured period. A value of -38 represents an extreme level of underperformance relative to volatility, historically associated with major market bottoms.
Q2: How reliable is the Sharpe Ratio for predicting Bitcoin cycle bottoms?
While not a perfect timing tool, extreme Sharpe Ratio readings have coincided with major cycle lows in 2015, 2019, and 2022. It functions best as a confirming indicator alongside other metrics like MVRV Z-Score and Puell Multiple.
Q3: Does a low Sharpe Ratio guarantee that Bitcoin’s price will increase soon?
No single metric guarantees future price movements. Extreme readings identify high-stress environments where long-term risk/reward profiles improve, but prices can remain depressed for extended periods before recovering.
Q4: What other indicators should investors watch alongside the Sharpe Ratio?
Key complementary metrics include exchange net flows, long-term holder supply changes, realized profit/loss ratios, and derivatives market funding rates. Macroeconomic indicators like dollar strength and bond yields also provide crucial context.
Q5: How does the current ‘max pain zone’ differ from previous cycles?
The current environment features unprecedented institutional participation through spot ETFs, different regulatory landscapes, and Bitcoin’s maturation as a macro asset. These factors may alter the duration and characteristics of the bottoming process compared to earlier cycles.