XRP Price Stages Dramatic 50% Rebound as Critical Indicators Signal Potential Market Bottom Formation
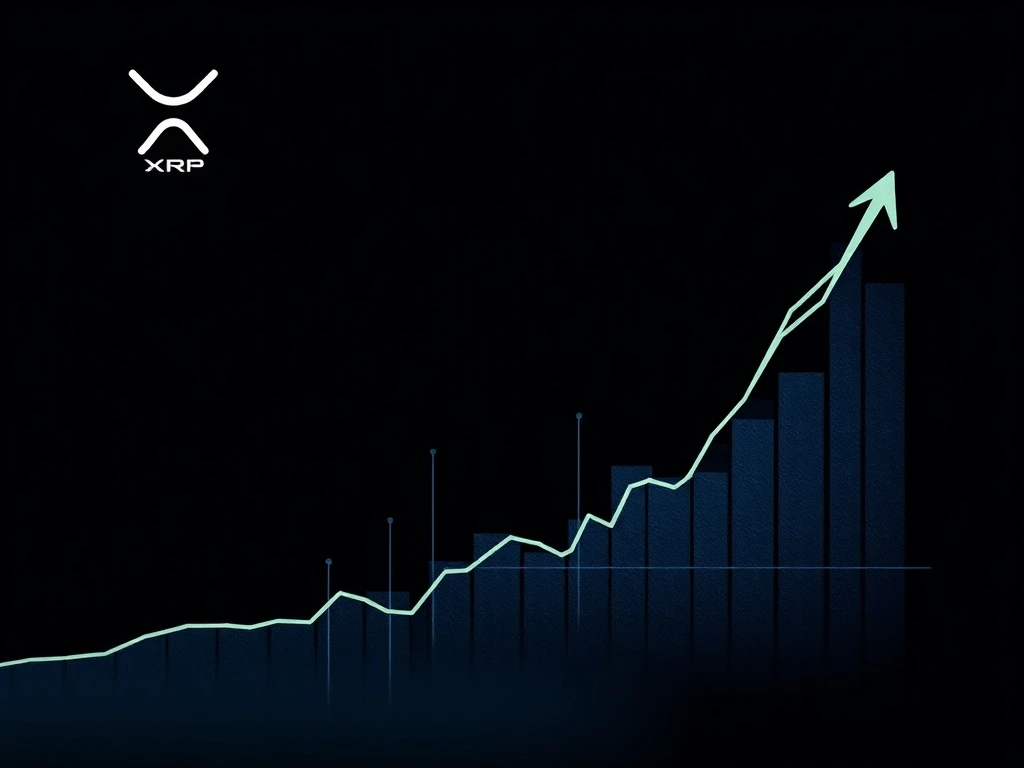
February 2025 witnessed a dramatic reversal for XRP as the digital asset surged 50% from its 15-month low, sparking intense analysis about whether this movement signals a genuine market bottom formation. The cryptocurrency’s recovery from $1.12 on February 6 to $1.67 represents one of the most significant rebounds in the current market cycle, coinciding with three critical technical indicators that historically precede sustained recoveries.
XRP Price Rebound Analysis and Market Context
The cryptocurrency market experienced substantial volatility throughout early 2025, with XRP particularly affected by regulatory developments and shifting institutional sentiment. Consequently, the asset reached its lowest valuation since November 2023 before initiating its remarkable recovery. This price action mirrors historical patterns where assets establish support levels after prolonged declines. Market analysts immediately began examining whether this represents a temporary bounce or a fundamental shift in market structure.
Several factors contributed to the selling pressure that preceded the rebound. First, exchange reserves decreased significantly across major platforms, indicating potential accumulation by long-term holders. Second, funding rates turned negative across perpetual swap markets, creating conditions favorable for short squeezes. Third, spot exchange volumes increased substantially during the recovery phase, suggesting genuine buying interest rather than algorithmic trading alone.
Three Key Indicators Supporting Bottom Formation
Technical analysts identify three primary metrics that currently support the bottom formation thesis for XRP. These indicators provide objective data points rather than speculative opinions about market direction.
Negative Funding Rates and Market Sentiment
Perpetual swap funding rates turned decisively negative before the rebound, reaching levels not seen since the 2023 market lows. Typically, sustained negative funding indicates excessive bearish positioning among leveraged traders. This creates conditions where even modest buying pressure can trigger cascading short covering, amplifying upward price movements. Historical data shows that similar funding conditions preceded major trend reversals in 2019 and 2021.
The funding rate mechanism serves as a sentiment gauge across cryptocurrency derivatives markets. When traders overwhelmingly bet against an asset through short positions, exchanges automatically transfer fees from shorts to longs to balance positions. This negative funding environment persisted for approximately two weeks before the rebound began, suggesting sentiment reached extreme pessimism levels.
Exchange Reserve Depletion and Holder Behavior
On-chain data reveals substantial decreases in exchange-held XRP reserves throughout the decline phase. Major platforms collectively reported reserve reductions exceeding 15% from January peaks. Analysts interpret this movement as accumulation by entities moving assets to private wallets for long-term storage. Such behavior typically precedes price recoveries because it reduces immediate selling pressure and indicates confidence among larger holders.
The reserve analysis becomes particularly significant when examined alongside wallet distribution statistics. Addresses holding between 10,000 and 1,000,000 XRP increased their collective holdings by approximately 8% during the same period that exchange reserves declined. This correlation strengthens the accumulation thesis and provides on-chain validation for the price recovery narrative.
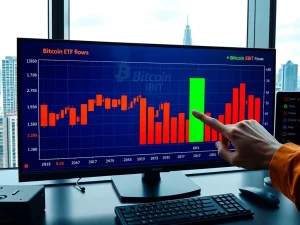
ETF Inflows and Institutional Participation
Spot cryptocurrency ETF products recorded consistent inflows during the price decline, with XRP-focused instruments attracting particular attention. Although XRP lacks direct spot ETF approval in major markets, related products and basket funds containing the asset showed increased institutional interest. These inflows provide fundamental support that differs from retail-driven speculation because they represent longer-term capital allocation decisions.
The institutional perspective matters significantly for market structure analysis. Professional investors typically employ different time horizons and risk management approaches compared to retail participants. Their involvement during market weakness suggests valuation assessments based on fundamentals rather than short-term price momentum. This behavior pattern historically correlates with sustainable recovery phases rather than temporary rallies.
Historical Comparisons and Technical Patterns
Current market conditions share similarities with previous cryptocurrency cycle bottoms, though each period maintains unique characteristics. The 2018-2019 bear market concluded with comparable indicators including negative funding extremes, exchange outflow patterns, and gradual institutional re-engagement. However, the 2025 market operates within a more mature regulatory framework and features substantially greater institutional participation.
Technical analysts emphasize several chart patterns that developed during the recent price action. The weekly timeframe shows a clear double bottom formation with the November 2023 and February 2025 lows establishing a support zone. Additionally, momentum indicators including the Relative Strength Index (RSI) and Moving Average Convergence Divergence (MACD) displayed bullish divergences during the final decline phase. These divergences occur when price makes lower lows while momentum indicators make higher lows, suggesting weakening selling pressure.
Volume Analysis and Market Structure
Trading volume patterns provide crucial context for evaluating price movements. The rebound occurred alongside volume spikes exceeding 200% of the 30-day average, indicating strong participation. More importantly, volume during upward movements substantially exceeded volume during downward movements throughout the recovery phase. This volume profile typically characterizes genuine accumulation rather than short-covering alone.
Market structure analysis reveals additional supportive elements. The price successfully reclaimed several key moving averages that previously acted as resistance, including the 20-day and 50-day exponential moving averages. Furthermore, the asset established higher lows on shorter timeframes, creating a constructive pattern for continued recovery. These technical developments complement the fundamental indicators discussed earlier.
Regulatory Developments and Market Impact
The regulatory landscape for XRP continues evolving in 2025, with several jurisdictions clarifying their positions regarding the asset’s classification. These developments influence market structure by affecting institutional participation parameters and exchange listing policies. While regulatory matters extend beyond technical analysis, they create important context for understanding capital flow patterns and investor behavior.
Market participants particularly monitor developments in major financial centers including the United States, European Union, and United Kingdom. Regulatory clarity typically precedes increased institutional allocation as compliance requirements become more defined. The timing of recent price action coincides with progress on several regulatory fronts, though analysts caution against drawing direct causal relationships between specific announcements and short-term price movements.
Risk Factors and Alternative Scenarios
Despite encouraging indicators, several risk factors warrant consideration. First, broader cryptocurrency market conditions remain volatile with correlations between assets persisting at elevated levels. Second, macroeconomic factors including interest rate policies and geopolitical developments continue influencing risk asset valuations. Third, the technical recovery requires confirmation through sustained price action above key resistance levels.
Analysts outline alternative scenarios where current movements represent bear market rallies rather than genuine trend reversals. Historical data shows that similar rebounds occurred during the 2018 decline before prices established new lows. The critical distinction between bear market rallies and genuine bottoms typically emerges through follow-through price action and volume patterns in subsequent weeks.
Conclusion
The XRP price rebound of 50% from February lows coincides with multiple technical indicators that historically signal market bottom formation. Negative funding rates, declining exchange reserves, and institutional ETF inflows collectively suggest shifting market dynamics rather than temporary price movements alone. While risks persist in the volatile cryptocurrency environment, the convergence of these factors provides objective evidence for potential trend change. Market participants will monitor whether the asset can maintain momentum above key technical levels as the 2025 market cycle continues developing. The XRP price action ultimately reflects broader cryptocurrency market evolution toward increased institutional participation and more mature technical patterns.
FAQs
Q1: What caused XRP’s 50% price rebound in February 2025?
The rebound resulted from converging factors including extreme negative funding rates triggering short squeezes, substantial exchange reserve declines indicating accumulation, and consistent ETF inflows showing institutional interest during market weakness.
Q2: How do negative funding rates signal potential market bottoms?
Negative funding rates indicate excessive bearish positioning among leveraged traders. When this condition becomes extreme, even modest buying can trigger cascading short covering that amplifies upward price movements and potentially marks sentiment extremes.
Q3: What does declining exchange reserves indicate about market sentiment?
Decreasing exchange reserves typically suggest assets moving to private wallets for long-term holding rather than immediate trading. This behavior reduces potential selling pressure and often indicates accumulation by confident investors during price declines.
Q4: How significant are ETF inflows for cryptocurrency market structure?
ETF inflows represent institutional capital allocation decisions based on longer time horizons and fundamental analysis. Their presence during market weakness suggests professional investors see value at current levels, which differs from short-term speculative trading.
Q5: What technical patterns support the XRP bottom formation thesis?
Key technical patterns include weekly double bottom formation, bullish momentum divergences on key indicators, volume spikes on upward movements, and successful reclamation of important moving averages that previously acted as resistance.