AAVE Price Analysis: Critical Support Holds After 86% Decline – Potential Recovery Pattern Emerging in 2025 Market
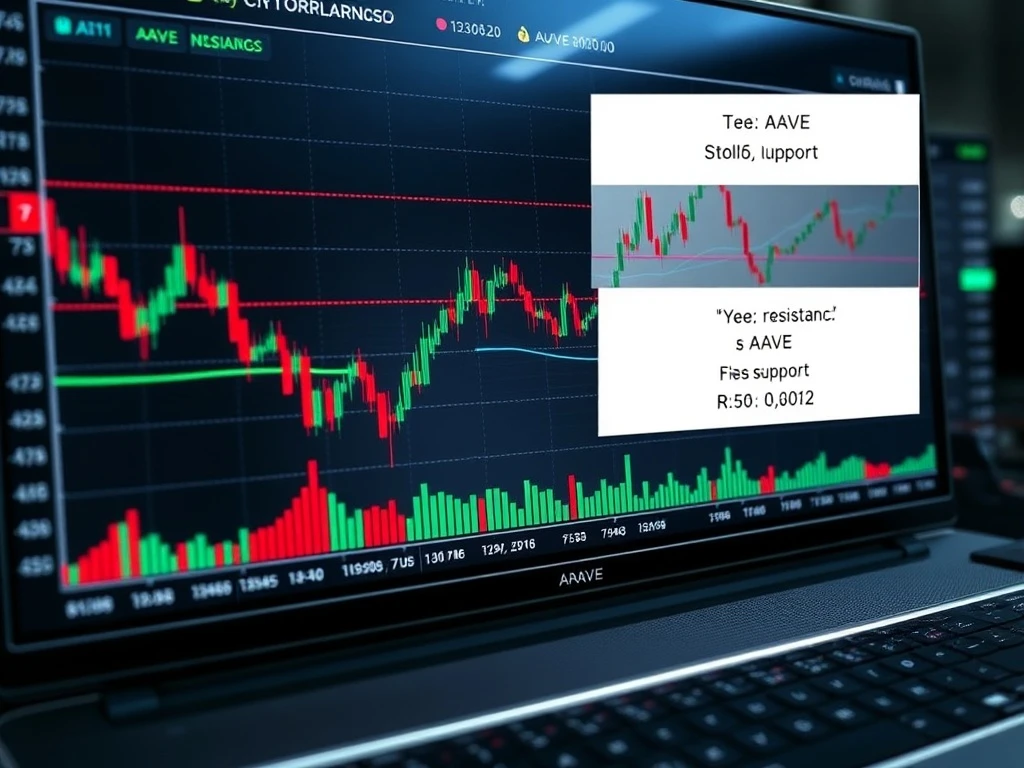
As of March 2025, the AAVE cryptocurrency maintains a critical technical position, trading near $124 while holding above the $90 support level following an 86% decline from its all-time high. Market analysts now monitor whether this decentralized finance token can establish a sustainable recovery pattern amid evolving 2025 cryptocurrency market conditions.
AAVE Price Analysis: Technical Context and Current Position
The AAVE token currently trades within what technical analysts describe as a higher time frame support zone. This area represents a confluence of historical price action and psychological levels that have previously demonstrated significance. Specifically, the $90-$125 range has served as both resistance and support during different market cycles since 2021. Furthermore, this zone aligns with Fibonacci retracement levels from the 2020-2021 bull market advance, adding technical validation to its importance.
Market participants observe several key technical factors. First, trading volume patterns show decreasing selling pressure near current levels. Second, on-chain metrics indicate reduced token movement from long-term holders. Third, the relative strength index (RSI) displays potential divergence on weekly charts. However, analysts emphasize that technical indicators alone cannot guarantee future price direction without fundamental catalysts.
Historical Context and Market Structure
AAVE’s current position reflects broader cryptocurrency market dynamics. The token reached its all-time high of approximately $666 in May 2021 during the peak of the DeFi summer phenomenon. Subsequently, it experienced the market-wide correction that affected most digital assets throughout 2022 and 2023. The 86% decline aligns with similar drawdowns experienced by other major DeFi tokens during the same period, suggesting sector-wide rather than token-specific dynamics.
Market structure analysis reveals that AAVE has established what technical traders call “higher lows” on monthly charts since establishing the $90 support level in June 2023. This pattern suggests potential accumulation activity, though confirmation requires sustained price action above key resistance levels. The token’s current position represents approximately the 0.236 Fibonacci retracement level from its all-time high to the 2023 low, a common area for trend reversals in technical analysis.
DeFi Market Evolution and AAVE’s Fundamental Position
The decentralized finance sector has undergone significant evolution since AAVE’s peak. Protocol upgrades, including the introduction of AAVE v3 with enhanced risk management features and cross-chain functionality, have strengthened the platform’s technical foundation. Additionally, governance improvements and real-world asset integration initiatives have expanded AAVE’s potential use cases beyond traditional crypto lending markets.
Key fundamental metrics provide context for AAVE’s current valuation. The protocol continues to maintain its position among the top three lending platforms by total value locked (TVL), with approximately $8.5 billion across supported networks as of Q1 2025. Revenue generation remains stable despite market volatility, with the protocol capturing fees from lending activities and flash loan transactions. These fundamental factors contribute to the technical support level’s significance.
Critical factors influencing AAVE’s potential recovery include:
- Protocol upgrade adoption rates across multiple blockchain networks
- Regulatory developments affecting DeFi lending protocols
- Competitive landscape evolution within decentralized finance
- Broader cryptocurrency market liquidity conditions
- Institutional adoption of DeFi infrastructure
Analyst Perspectives and Price Projections
Technical analysts reference several potential scenarios based on current chart patterns. The primary bullish case suggests that holding the $90 support could establish a base for gradual recovery toward the $190 resistance level, representing approximately a 53% increase from current prices. Beyond that, some analysts identify longer-term targets in the $500-$1,000 range, contingent on both technical breakout confirmation and fundamental improvements.
However, risk management remains paramount according to market professionals. Analysts emphasize that breakdown below the $90 support could trigger further declines toward the $60-$70 range, where the next significant historical support exists. This balanced perspective reflects the uncertainty inherent in cryptocurrency markets, particularly during transitional periods between market cycles.
| Price Level | Type | Significance |
|---|---|---|
| $90 | Support | Critical higher time frame level |
| $124 | Current Price | Testing resistance confluence |
| $190 | Resistance | First major recovery target |
| $300 | Resistance | Psychological and technical level |
| $500-$1,000 | Long-term Target | Contingent on multiple factors |
Market Dynamics and Comparative Analysis
The cryptocurrency market of 2025 presents different dynamics than previous cycles. Institutional participation has increased substantially, with regulated products gaining traction across global financial markets. This institutionalization affects volatility patterns and correlation structures between different digital assets. AAVE’s performance must therefore be analyzed within this evolving market context rather than through historical patterns alone.
Comparative analysis reveals that AAVE’s 86% decline from all-time highs aligns with similar drawdowns experienced by other major DeFi tokens. Compound (COMP) shows an 89% decline, while Maker (MKR) demonstrates an 84% decline from respective peaks. This correlation suggests sector-wide dynamics rather than protocol-specific issues. However, recovery trajectories have diverged among these tokens, highlighting the importance of individual protocol developments alongside broader market movements.
Market liquidity conditions significantly influence technical patterns. The 2024-2025 period has seen increased stablecoin adoption and improved market infrastructure, potentially providing more stable support levels than during previous bear markets. Additionally, derivatives market development has created more sophisticated hedging opportunities, potentially reducing extreme volatility during market transitions.
Risk Factors and Considerations
Several risk factors could affect AAVE’s potential recovery pattern. Regulatory developments represent a primary concern, with multiple jurisdictions considering DeFi-specific legislation. Protocol security remains paramount, as lending platforms represent attractive targets for sophisticated attacks. Furthermore, competitive pressures continue to intensify as both traditional finance and newer DeFi protocols innovate in the lending space.
Macroeconomic conditions also influence cryptocurrency markets. Interest rate environments, inflation trends, and traditional market correlations all contribute to digital asset valuation models. The 2025 economic landscape presents unique challenges and opportunities that differ from previous cryptocurrency cycles, requiring updated analytical frameworks for accurate assessment.
Conclusion
The AAVE price analysis reveals a cryptocurrency at a critical technical juncture, holding key support after significant decline. While potential recovery patterns toward $190-$1,000 targets exist in analyst projections, realization depends on multiple factors including technical confirmation, fundamental developments, and broader market conditions. The 2025 cryptocurrency market presents evolving dynamics that require careful analysis beyond historical patterns alone. Market participants should monitor both technical levels and fundamental metrics when assessing AAVE’s potential trajectory in the current market environment.
FAQs
Q1: What is the current support level for AAVE?
The primary support level for AAVE sits at approximately $90, representing a higher time frame technical area that has demonstrated significance during previous market cycles.
Q2: How much has AAVE declined from its all-time high?
AAVE has experienced approximately an 86% decline from its all-time high of $666 reached in May 2021, aligning with broader DeFi sector corrections during the same period.
Q3: What factors could drive AAVE’s recovery?
Potential recovery drivers include successful protocol upgrades, increased adoption of DeFi lending, improved cryptocurrency market conditions, and specific fundamental developments within the AAVE ecosystem.
Q4: What are the main risk factors for AAVE?
Primary risks include regulatory developments affecting DeFi protocols, security vulnerabilities, competitive pressures, broader market volatility, and macroeconomic conditions influencing digital asset valuations.
Q5: How does AAVE’s performance compare to other DeFi tokens?
AAVE’s 86% decline aligns with similar drawdowns in other major DeFi tokens, suggesting sector-wide dynamics, though recovery trajectories have shown divergence based on individual protocol developments.