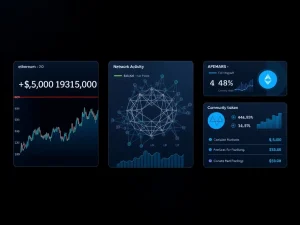
Crypto Market Cap Defies Extreme Fear, Surging to $2.42T as Bitcoin Tops $70K

Global cryptocurrency markets displayed remarkable resilience on March 25, 2025, as the total market capitalization climbed to $2.42 trillion. This surge occurred despite prevailing investor sentiment registering in the ‘Extreme Fear’ zone. Bitcoin, the leading digital asset, spearheaded the movement by reclaiming the psychologically significant $70,000 threshold. Meanwhile, the decentralized finance (DeFi) sector witnessed a notable increase in total value locked (TVL). In stark contrast, the non-fungible token (NFT) market experienced a sharp and pronounced decline in sales volume over the same 24-hour period.
Crypto Market Cap Climbs Amid Contradictory Sentiment
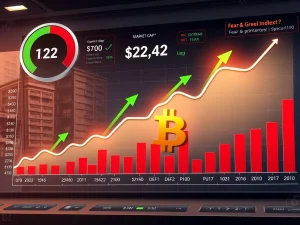
The cryptocurrency market’s aggregate valuation rose to approximately $2.42 trillion, marking a significant recovery from recent lows. This upward movement presents a fascinating paradox when analyzed alongside the Crypto Fear & Greed Index. For context, this widely-referenced sentiment indicator plummeted to a reading of 15, solidly within its ‘Extreme Fear’ classification. Historically, such readings often correlate with market capitulation or stagnation, not rallies. Consequently, the current price action suggests a potential decoupling between short-term trader sentiment and underlying capital flows. Market analysts frequently scrutinize this divergence for signals about institutional accumulation or long-term holder behavior during periods of retail uncertainty.
Analyzing the Fear and Greed Paradox
The Fear & Greed Index synthesizes data from volatility, market momentum, social media sentiment, surveys, and Bitcoin dominance. A sustained ‘Extreme Fear’ reading typically follows significant price corrections or adverse regulatory news. The market’s ability to advance despite this backdrop implies strong foundational support. Several factors could explain this resilience. First, sustained institutional investment through regulated exchange-traded products provides a steady demand base. Second, macroeconomic conditions, such as currency devaluation concerns in certain regions, continue to drive asset diversification. Finally, the continued maturation of blockchain infrastructure lends fundamental credibility that may outweigh transient emotional indicators.
Bitcoin Price Action: Reclaiming the $70,000 Milestone
Bitcoin’s price ascended past $70,000, reinforcing its position as the primary market driver. This price level represents a crucial resistance-turned-support zone from previous market cycles. The breakthrough followed a consolidation period characterized by lower volatility, which often precedes a decisive move. On-chain data reveals specific supply dynamics at play. For instance, the percentage of Bitcoin supply held by long-term investors remains near all-time highs. Furthermore, exchange reserves continue to decline, indicating a net withdrawal of coins from trading platforms into cold storage. This reduction in readily available supply, against steady or increasing demand, creates upward price pressure. The move also coincided with increased options market activity, with traders positioning for potential further upside.
- Long-Term Holder Supply: Remains elevated, suggesting strong conviction.
- Exchange Netflow: Predominantly negative, indicating accumulation.
- MVRV Ratio: Signals profit-taking is not at extreme levels.
DeFi TVL Rises as Fundamentals Strengthen
Parallel to Bitcoin’s performance, the total value locked across all DeFi protocols increased noticeably. TVL, a key metric representing the sum of all assets deposited in DeFi smart contracts, serves as a health indicator for the sector. This growth was not uniform but concentrated in specific verticals. Leading lending platforms and liquid staking derivatives observed the most significant capital inflows. The rise suggests that capital is seeking yield-generating opportunities within the crypto ecosystem rather than exiting entirely. Importantly, this TVL growth occurred without a corresponding spike in network gas fees on Ethereum or major Layer-2 solutions, indicating efficient scaling. Developers have recently launched several protocol upgrades focusing on security and user experience, which may be bolstering confidence.
| Category | TVL Change | Notable Driver |
|---|---|---|
| Lending Protocols | +4.2% | Increased stablecoin borrowing |
| Liquid Staking | +3.8% | New validator queue mechanisms |
| Decentralized Exchanges | +1.5% | Fee switch activations |
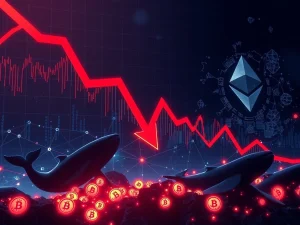
NFT Market Experiences Sharp Sales Plunge
In a contrasting trend, the NFT market faced a substantial downturn. Sales volume across major marketplaces like Blur and OpenSea dropped by over 35% in 24 hours. This decline affected both blue-chip collections and newer projects. Several interrelated factors contribute to this dynamic. First, market liquidity often rotates between asset classes; capital may be flowing from speculative NFTs into more established cryptocurrencies like Bitcoin or into yield-bearing DeFi positions. Second, the NFT market exhibits higher sensitivity to sentiment shifts and gas fee fluctuations. A broader analysis of NFT metrics reveals a decline in unique buyer numbers and average sale price, not just total volume. This pattern suggests a cooling of retail speculative fervor, which often leads the broader market in both directions.
The Liquidity Rotation Hypothesis
Market cycles frequently feature rotational dynamics where capital moves between different crypto subsectors. The simultaneous rise in Bitcoin/DeFi and fall in NFTs fits a historical pattern where investors seek perceived ‘safe-haven’ crypto assets or productive yield during uncertain times. NFTs, as a more nascent and illiquid asset class, often experience amplified volatility. This rotation does not necessarily indicate a fundamental flaw in the NFT utility thesis—which spans digital art, gaming, and intellectual property—but rather a short-term repricing of risk. Data from blockchain analytics firms shows wallet activity: many addresses selling NFTs were simultaneously increasing their holdings of Bitcoin or stablecoins.
Conclusion
The crypto market cap reaching $2.42 trillion amidst extreme fear underscores the complex, multi-faceted nature of digital asset markets. Bitcoin’s reclaiming of $70,000 demonstrates core strength, while rising DeFi TVL highlights robust underlying utility. The sharp plunge in NFT sales, however, serves as a reminder of the sector’s volatility and its role as a sentiment bellwether. Together, these movements paint a picture of a maturing market where different segments can diverge based on unique fundamentals, even as they remain interconnected. For investors and observers, the key takeaway is the importance of analyzing on-chain data, sector-specific metrics, and broad sentiment indicators in tandem to navigate this evolving landscape.
FAQs
Q1: What does ‘Extreme Fear’ on the Crypto Fear & Greed Index mean?
The ‘Extreme Fear’ classification indicates that current market sentiment, derived from volatility, momentum, social media, and survey data, is overwhelmingly negative. It often presents a potential contrarian investment signal, as it can coincide with market bottoms, though it is not a timing tool.
Q2: Why would the crypto market cap rise if investors are fearful?
Market capitalization is a function of price and supply. A rising market cap during fear can indicate strong buying pressure from long-term holders or institutions that operate independently of retail sentiment metrics, potentially seeing value at lower prices.
Q3: What is Total Value Locked (TVL) in DeFi?
TVL is the total amount of user funds deposited in DeFi smart contracts for lending, borrowing, staking, or providing liquidity. It is a key metric for gauging the scale, usage, and economic security of the decentralized finance ecosystem.
Q4: How are NFT sales and Bitcoin prices related?
They are often correlated in the long term, as both are crypto-native assets, but can diverge sharply in the short term. NFT markets tend to be more speculative and sensitive to liquidity conditions, sometimes leading or lagging major cryptocurrency price movements.
Q5: Could this market structure indicate a new bull phase?
While Bitcoin breaking key resistance is a positive technical sign, and DeFi growth suggests fundamental health, declaring a new bull phase requires sustained momentum across multiple timeframes and metrics. The NFT downturn also cautions that not all market segments are participating equally, suggesting selectivity.