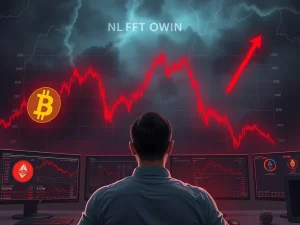
SUI Price Analysis Reveals $0.75 as a Critical Entry Point for Potential Bullish Momentum

Technical analysis of the SUI cryptocurrency suggests the $0.75 price level represents a significant support zone that could serve as a strategic entry point for investors monitoring potential bullish developments in the blockchain ecosystem. Market data from March 2025 indicates this level has demonstrated resilience during recent volatility, attracting attention from both retail and institutional participants in the digital asset space. The SUI network, developed by Mysten Labs and launched in 2023, continues to evolve within the competitive layer-1 blockchain landscape, with its price movements reflecting broader market sentiment toward scalable smart contract platforms.
SUI Price Analysis and Technical Indicators
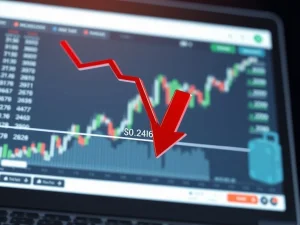
Recent SUI price analysis reveals consistent support around the $0.75 level across multiple timeframes. Technical indicators including moving averages and volume profiles show this zone has attracted substantial buying interest during market corrections. The 200-day moving average currently converges near this price point, adding to its technical significance. Furthermore, on-chain data indicates increased accumulation by long-term holders when prices approach this threshold, suggesting fundamental confidence in the network’s underlying value proposition.
Market analysts typically examine several key metrics when evaluating support levels. Trading volume patterns show notable spikes when SUI tests the $0.75 region, indicating active participation. Relative strength index readings have consistently rebounded from oversold conditions at this level during the past six months. Additionally, order book analysis reveals substantial buy orders clustered around $0.75, creating what technical analysts describe as a “demand zone” that could potentially limit further downside movement.
Historical Context and Price Action Patterns
Historical SUI price action provides important context for current technical analysis. Since its mainnet launch, SUI has established several identifiable support and resistance levels that have guided price discovery. The $0.75 level previously served as resistance in late 2024 before transforming into support in early 2025, a classic technical pattern known as “role reversal.” This transformation often indicates shifting market psychology and can signal changing investor sentiment toward an asset.
Comparative analysis with other layer-1 blockchain tokens reveals similar patterns during their respective development phases. Many successful blockchain projects experienced consolidation periods around psychologically significant price levels before subsequent upward movements. The current SUI price structure shows similarities to these historical patterns, though analysts emphasize that past performance never guarantees future results in volatile cryptocurrency markets.
Blockchain Fundamentals and Network Development
The SUI blockchain’s technical fundamentals provide essential context for price analysis. As a permissionless layer-1 blockchain designed for low-latency transactions, SUI utilizes a novel consensus mechanism called Narwhal-Bullshark. Network metrics show consistent growth in several key areas:
- Daily Transactions: Increased from approximately 500,000 in Q4 2024 to over 1.2 million in Q1 2025
- Active Addresses: Grew by 85% during the same period
- Total Value Locked (TVL): Reached $150 million across decentralized applications
- Developer Activity: Over 300 active projects building on the network
These fundamental metrics contribute to the network’s valuation framework. Blockchain analysts typically correlate network usage growth with long-term price appreciation potential, though the relationship remains complex and non-linear. The SUI Foundation’s ongoing development grants and ecosystem funding initiatives continue to attract developers, potentially creating network effects that could influence future price discovery.
Market Structure and Investor Psychology
Current market structure analysis reveals distinct investor behavior patterns around the $0.75 level. Exchange flow data indicates reduced selling pressure when prices approach this threshold, suggesting many holders view this as an accumulation zone rather than an exit point. Derivatives market positioning shows reduced leverage at this level, potentially decreasing the likelihood of cascading liquidations that sometimes exacerbate downward movements in cryptocurrency markets.
Psychological factors significantly influence cryptocurrency price action. Round number price levels like $0.75 often attract attention due to their cognitive accessibility for market participants. Behavioral finance research suggests these levels can become self-reinforcing as traders place orders at psychologically significant prices. This phenomenon sometimes creates temporary support or resistance zones that technical analysts monitor for potential trading opportunities.
Risk Considerations and Market Dynamics
All cryptocurrency investments involve substantial risk, and technical analysis represents just one approach to market evaluation. Several factors could potentially invalidate the $0.75 support thesis:
| Risk Factor | Potential Impact | Monitoring Indicators |
|---|---|---|
| Broader Market Correction | Could overwhelm technical support levels | Bitcoin dominance, total market cap |
| Network Development Delays | Might reduce investor confidence | GitHub commits, roadmap milestones |
| Regulatory Developments | Could impact all cryptocurrency assets | Policy announcements, enforcement actions |
| Competitive Pressure | Might reduce SUI’s market position | Comparative network metrics, developer migration |
Market participants should consider these risk factors alongside technical analysis when making investment decisions. Diversification across asset classes and careful position sizing remain essential risk management practices in volatile markets. Furthermore, cryptocurrency investments should typically represent only a portion of a balanced investment portfolio aligned with individual risk tolerance and financial objectives.
Comparative Analysis with Similar Assets
Comparative technical analysis provides additional perspective on SUI’s price action. When examining similar layer-1 blockchain tokens during comparable development phases, several patterns emerge. Many experienced consolidation periods lasting several months before establishing sustained upward trends. Trading volume patterns often preceded significant price movements, with increasing volume during consolidation sometimes indicating accumulation by informed investors.
The broader blockchain sector’s performance significantly influences individual token price action. Correlation analysis shows SUI maintains approximately 0.7 correlation with the broader cryptocurrency market index, indicating substantial but not complete dependence on overall market direction. This correlation coefficient suggests that while broader market movements importantly influence SUI’s price, network-specific developments also meaningfully impact its valuation relative to other digital assets.
Conclusion
SUI price analysis indicates the $0.75 level represents a technically significant support zone based on historical price action, volume patterns, and on-chain metrics. This SUI price analysis provides a framework for understanding current market structure, though investors should consider multiple analytical approaches alongside fundamental network developments. The cryptocurrency market remains inherently volatile, and technical levels sometimes break despite appearing strong. Responsible investment practices require continuous monitoring of both technical indicators and fundamental network developments within appropriate risk management frameworks.
FAQs
Q1: What technical indicators support the $0.75 level as significant for SUI?
Multiple technical indicators converge around $0.75, including the 200-day moving average, historical volume profiles showing accumulation, and repeated price rejections from lower levels. On-chain data also indicates increased holder accumulation near this price point.
Q2: How does SUI’s network growth potentially influence its price?
Network fundamentals including transaction volume, active addresses, and developer activity contribute to long-term valuation frameworks. Growing network usage typically correlates with increased utility value, though the relationship with short-term price action remains complex and influenced by many factors.
Q3: What risks should investors consider regarding this technical analysis?
Technical analysis represents probabilistic scenarios, not certain predictions. Risks include broader market corrections, network development challenges, regulatory changes, and competitive pressures that could invalidate technical support levels despite appearing strong.
Q4: How does SUI’s price action compare to other layer-1 blockchain tokens?
Comparative analysis shows similarities in consolidation patterns during development phases. Many successful layer-1 tokens experienced extended consolidation around psychologically significant price levels before establishing sustained upward trends, though past patterns never guarantee future results.
Q5: What time horizon typically applies to this type of technical analysis?
The $0.75 support analysis primarily applies to intermediate-term timeframes ranging from weeks to several months. Technical patterns often evolve as market conditions change, requiring continuous monitoring rather than static assumptions about future price action.