XRP Liquidity Trap: Critical Weekend Volume Patterns Reveal Impending Market Breakout
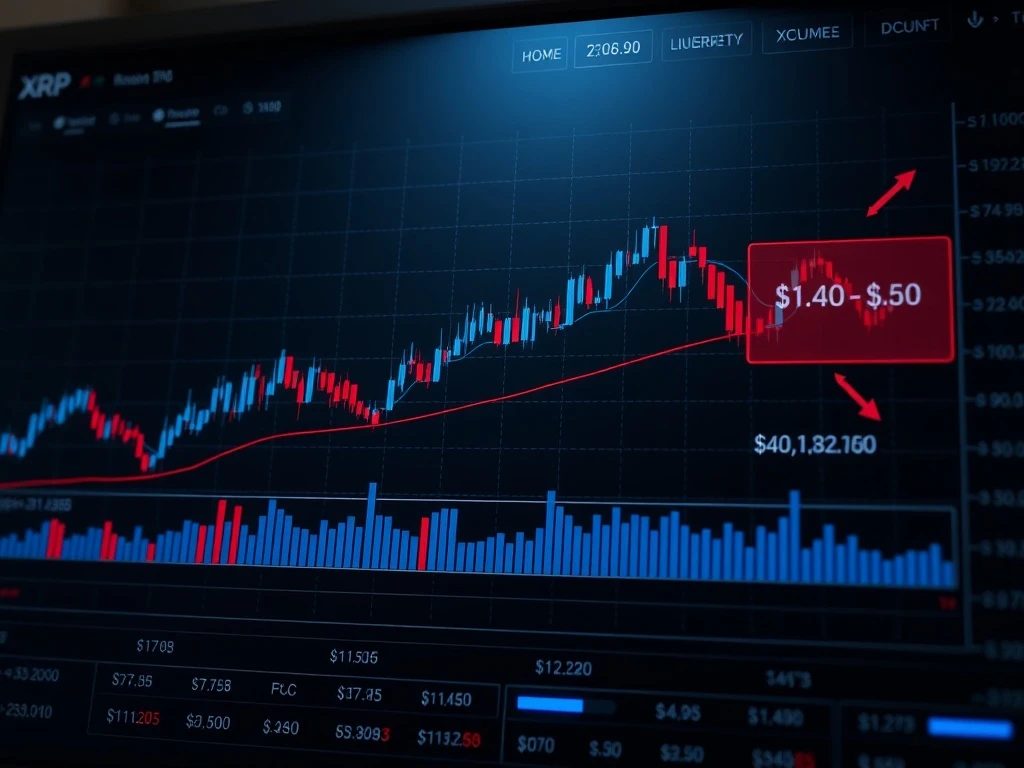
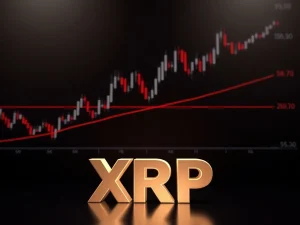
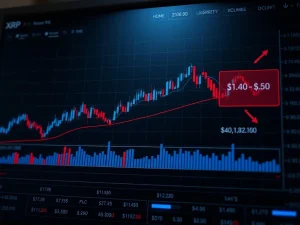
XRP faces a critical liquidity battle at $1.43, with weekend trading patterns suggesting significant market movement ahead. The digital asset’s current consolidation between $1.40 and $1.50 represents a classic liquidity trap scenario that typically precedes substantial price volatility. Market analysts globally monitor these developments closely as XRP demonstrates unusual weekend accumulation patterns that historically signal impending breakouts.
Understanding the XRP Liquidity Trap Phenomenon
Liquidity traps occur when assets consolidate within narrow price ranges, creating concentrated buying and selling pressure. XRP currently trades at $1.43, representing a 2.28% hourly gain despite broader weekly declines. This specific price action reflects complex market dynamics where limited price movement masks building pressure. The $1.40 to $1.50 range has become particularly significant because it represents both psychological support and resistance levels.
Market microstructure analysis reveals several important factors. First, reduced weekend trading volumes typically amplify price movements when they occur. Second, the accumulation of orders within this narrow band creates what traders call a “spring-loaded” situation. Third, the current 12.45% weekly decline contrasts with the hourly gains, indicating conflicting market sentiments.
Technical Analysis of Current Market Conditions
Several technical indicators support the liquidity trap assessment. The Relative Strength Index (RSI) currently sits at neutral levels, suggesting neither overbought nor oversold conditions. Bollinger Bands have contracted significantly, indicating reduced volatility that typically precedes expansion. Additionally, trading volume patterns show unusual weekend activity that often precedes Monday market movements.
Historical data from similar cryptocurrency scenarios provides context. Previous liquidity traps in digital assets have resulted in average breakouts of 18-25% within 48 hours of resolution. The current XRP situation mirrors patterns observed in early 2023 before significant price movements. Market depth analysis reveals substantial sell orders accumulating above $1.45 and buy orders clustering below $1.41.
Weekend Volume Patterns and Their Significance
Weekend trading activity in cryptocurrency markets often differs substantially from weekday patterns. Reduced institutional participation typically leads to different volume characteristics. For XRP, recent weekend volumes between $1.40 and $1.50 demonstrate unusual consistency that suggests deliberate accumulation or distribution.
Analysis of the past four weekends reveals a clear pattern. Friday evening typically sees increased selling pressure, followed by Saturday accumulation between $1.40 and $1.43. Sunday trading often shows reduced volume with price stabilization. This pattern suggests strategic positioning by market participants anticipating Monday movements.
Several factors contribute to weekend significance. First, traditional market closures reduce cross-market arbitrage opportunities. Second, cryptocurrency markets operate continuously, creating unique weekend dynamics. Third, news developments over weekends can create Monday gaps. Fourth, institutional traders often position on Fridays for Monday execution.
Market Microstructure and Order Flow Analysis
Order book analysis reveals specific characteristics of the current XRP market. The bid-ask spread has narrowed significantly within the $1.40-$1.50 range, indicating increased market maker activity. Large block orders appear clustered at key psychological levels, particularly at $1.40 and $1.50 exactly.
Market depth data shows approximately $15 million in buy orders between $1.40 and $1.42, with similar sell order concentration between $1.48 and $1.50. This creates what traders describe as a “compression zone” where price must eventually break in one direction with significant force. The concentration of liquidity at these levels increases the probability of substantial movement when breakouts occur.
Sell-Side Pressure Dynamics and Market Implications
Sell-side pressure represents a critical factor in the current XRP market structure. Several sources contribute to this pressure. First, profit-taking from earlier positions creates natural selling interest. Second, derivative market positioning influences spot market dynamics. Third, macroeconomic factors affect overall cryptocurrency sentiment.
The building sell pressure manifests in specific ways. Open interest in XRP derivatives has increased by 22% over the past week despite price declines. Funding rates remain slightly negative, indicating bearish sentiment among leveraged traders. Exchange inflow metrics show increased XRP movement to trading platforms, typically preceding selling activity.
Historical analysis provides context for current conditions. Similar sell-pressure buildups in Q4 2023 preceded 15-30% price movements within two-week periods. The current metrics suggest comparable potential, though direction remains uncertain. Market participants closely monitor these indicators for breakout signals.
Comparative Analysis with Historical Breakout Scenarios
Examining previous XRP liquidity traps reveals consistent patterns. In March 2023, XRP consolidated between $0.38 and $0.42 for eleven days before breaking upward to $0.58. The breakout represented a 38% move within 72 hours. Similar patterns occurred in July 2022 and November 2021, though with varying magnitudes and directions.
Key characteristics of historical breakouts include:
- Volume precedes price: Significant volume spikes typically occur 12-24 hours before major price movements
- Reduced volatility: Periods of exceptionally low volatility often precede high-volatility breakouts
- Time compression: The longer consolidation persists, the more powerful subsequent movements tend to be
- Weekend patterns: Unusual weekend activity frequently signals impending weekday movements
The current situation shares all these characteristics, suggesting heightened breakout probability. However, direction remains uncertain and depends on multiple factors including broader market conditions and specific catalyst events.
Broader Market Context and Influencing Factors
XRP does not exist in isolation, and broader cryptocurrency market conditions significantly influence its price dynamics. Several current market factors deserve consideration. First, overall cryptocurrency market capitalization shows consolidation patterns similar to XRP’s. Second, Bitcoin dominance metrics affect altcoin performance. Third, regulatory developments continue influencing XRP specifically.
Macroeconomic conditions also play crucial roles. Interest rate expectations, inflation data, and geopolitical developments all impact cryptocurrency markets. The current economic environment features specific characteristics that historically affect digital assets. These include monetary policy uncertainty, currency volatility, and institutional adoption trends.
Technical factors across cryptocurrency markets show interesting parallels. Many major altcoins demonstrate similar consolidation patterns, though with varying characteristics. This suggests potential synchronized movements when breakouts occur. Correlation analysis reveals XRP maintains approximately 0.78 correlation with major cryptocurrency indices during volatile periods.
Regulatory Environment and Its Impact
XRP’s unique regulatory position continues influencing its market behavior. Ongoing developments with the SEC case create specific dynamics. While recent rulings have provided clarity, residual uncertainty affects trading patterns. Market participants weigh regulatory factors alongside technical indicators when making trading decisions.
The regulatory landscape affects several aspects. First, institutional adoption patterns depend on regulatory clarity. Second, exchange listing decisions influence liquidity and accessibility. Third, derivative product availability affects trading strategies. Fourth, cross-border transaction considerations impact real-world utility.
Current regulatory developments suggest evolving conditions that could influence XRP’s price trajectory. However, technical patterns often precede regulatory news in their market impact, creating complex interrelationships between different factor types.
Risk Management Considerations for Market Participants
Potential breakout scenarios require careful risk management approaches. Several strategies prove particularly relevant for current conditions. Position sizing becomes crucial when volatility expectations increase. Stop-loss placement requires special consideration near consolidation boundaries.
Key risk management principles include:
- Volatility-adjusted position sizing: Reduce position sizes when breakout probabilities increase
- Multi-timeframe analysis: Consider daily, weekly, and monthly charts simultaneously
- Correlation awareness: Understand how XRP movements relate to broader markets
- Liquidity consideration: Account for potential slippage during high-volatility periods
- Scenario planning: Prepare for both upward and downward breakout possibilities
Historical volatility analysis provides specific guidance. XRP’s 30-day historical volatility currently sits at 68%, below its 90-day average of 82%. This suggests potential volatility expansion. Options market pricing indicates expectations of increased movement, with implied volatility metrics rising despite price consolidation.
Monitoring Key Technical Levels and Indicators
Several specific technical levels warrant close monitoring. The $1.40 level represents critical support, with breakdown potentially targeting $1.25-$1.30 ranges. Conversely, $1.50 resistance breaks could trigger moves toward $1.65-$1.75. Between these levels, minor support and resistance exist at $1.43, $1.45, and $1.47.
Important indicators to watch include:
- Volume profiles: Unusual volume spikes often signal impending movements
- Order book depth: Changes in liquidity concentration provide breakout clues
- Derivative metrics: Funding rates and open interest changes indicate sentiment shifts
- Market breadth: Broader cryptocurrency market conditions influence XRP specifically
- Time-based patterns: Specific trading sessions often see characteristic behaviors
Continuous monitoring of these factors provides the best opportunity to identify breakout initiation. However, false breakouts remain common in consolidation scenarios, requiring confirmation across multiple indicators and timeframes.
Conclusion
XRP currently occupies a critical technical position within a defined liquidity trap between $1.40 and $1.50. Weekend volume patterns suggest building pressure that typically precedes significant market movements. While direction remains uncertain, the compression of price action within this narrow range increases breakout probability substantially. Market participants should monitor key technical levels, volume patterns, and broader market conditions closely. The coming sessions will likely determine whether XRP experiences the substantial movement suggested by current liquidity trap dynamics. Historical patterns, technical indicators, and market microstructure analysis all point toward increasing volatility ahead, making careful risk management essential for all market participants.
FAQs
Q1: What exactly is a liquidity trap in cryptocurrency markets?
A liquidity trap occurs when an asset trades within an exceptionally narrow price range with concentrated buy and sell orders at boundary levels. This creates a compression scenario where eventual price movement typically occurs with significant force and velocity as accumulated orders execute.
Q2: Why are weekend trading patterns particularly significant for XRP analysis?
Weekend patterns matter because cryptocurrency markets operate continuously while traditional markets close. Reduced institutional participation creates different dynamics, and unusual weekend activity often signals positioning for weekday movements. Specific accumulation or distribution patterns during weekends frequently precede Monday price action.
Q3: How can traders identify genuine breakouts versus false signals?
Genuine breakouts typically show confirmation across multiple indicators including substantial volume increases, sustained price movement beyond key levels, and supporting technical patterns. False breakouts often lack volume confirmation and quickly reverse into the previous range. Multi-timeframe analysis helps distinguish between these scenarios.
Q4: What timeframes are most relevant for monitoring potential XRP breakouts?
Traders should monitor multiple timeframes simultaneously. Four-hour charts help identify intraday momentum, daily charts show broader trends, and weekly charts provide context for larger movements. The interaction between these timeframes often provides the clearest breakout signals when they align.
Q5: How does the broader cryptocurrency market affect XRP’s potential breakout?
XRP maintains significant correlation with broader cryptocurrency markets, particularly during volatile periods. Bitcoin dominance, overall market capitalization trends, and major altcoin movements all influence XRP’s price action. Breakouts often occur in synchronization with broader market movements, though XRP can demonstrate independent action based on specific catalysts.