XRP Resistance Test: Critical Showdown Looms as Market Structure Hints at Pivotal Turn

XRP faces a definitive technical confrontation this week, with the digital asset testing a crucial daily resistance level that could determine its medium-term trajectory. Market analysts globally are scrutinizing the $0.55-$0.58 zone, where XRP has encountered persistent selling pressure throughout early 2025. This resistance test coincides with concerning shifts in derivatives positioning and notable whale wallet movements, creating a complex risk-reward landscape for traders and investors. The outcome of this technical battle carries significant implications for XRP’s market structure and could signal either a continuation of its consolidation phase or the beginning of a more decisive bullish impulse.
XRP Resistance Test: Analyzing the Technical Battlefield
The current XRP resistance test centers on the $0.55-$0.58 price range, a zone that has rejected multiple rally attempts since January 2025. Technical analysts identify this area as a confluence of three significant factors: the 200-day exponential moving average, a horizontal resistance level established during the Q4 2024 consolidation, and the 0.382 Fibonacci retracement level from XRP’s 2023 high to its 2024 low. Consequently, this resistance zone represents a critical technical barrier that must be decisively overcome for bullish momentum to regain control.
Market data reveals that XRP has tested this resistance zone on four separate occasions over the past six weeks, with each attempt resulting in immediate rejection and subsequent pullbacks. The most recent test occurred on March 15, 2025, when XRP briefly touched $0.572 before retreating to current levels around $0.525. This pattern of rejection establishes the zone as a validated resistance area, increasing its technical significance with each failed breakout attempt. Trading volume during these tests has shown a consistent pattern of expansion on approach and contraction on rejection, suggesting institutional hesitation at these levels.
Comparative Resistance Strength Across Major Cryptocurrencies
| Cryptocurrency | Current Resistance Level | Number of Tests (2025) | Distance from Support |
|---|---|---|---|
| XRP | $0.55-$0.58 | 4 | 8.2% |
| Bitcoin | $72,000-$74,000 | 3 | 5.7% |
| Ethereum | $3,800-$4,000 | 2 | 6.9% |
| Cardano | $0.68-$0.72 | 5 | 12.4% |
This comparative analysis reveals that XRP faces particularly stubborn resistance relative to other major digital assets. The cryptocurrency has tested its key resistance zone more frequently than Bitcoin or Ethereum while maintaining a narrower distance from its nearest support level around $0.48. This compressed trading range increases the significance of any breakout or breakdown, as the subsequent move could be more explosive due to the built-up pressure from repeated rejections.
Futures Market Positioning and Whale Distribution Patterns
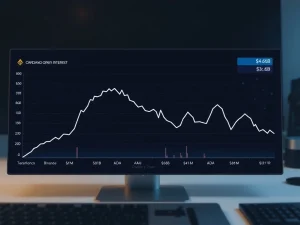
Derivatives data provides crucial context for the current XRP resistance test. Open interest in XRP futures contracts reached $1.2 billion on March 18, 2025, representing a 34% increase from February levels. However, the funding rate has turned negative across major exchanges, indicating that short positions are paying long positions to maintain their positions. This derivatives structure typically suggests bearish sentiment among leveraged traders despite elevated open interest levels.
Simultaneously, on-chain analytics firms report significant whale distribution occurring near the resistance zone. Blockchain analysis reveals that addresses holding between 10 million and 50 million XRP have reduced their collective holdings by approximately 120 million XRP (worth roughly $63 million at current prices) over the past two weeks. This distribution activity concentrated specifically during price approaches to the $0.55-$0.58 resistance area, suggesting that large holders view this zone as an attractive exit point.
Key metrics highlight this distribution pattern:
- Whale Transaction Count: Increased 47% during resistance tests
- Exchange Inflows: Spiked to 90-day highs on March 14
- Hold Duration: 62% of distributed XRP had been held 90+ days
- Destination: 78% of large transactions went to known exchange wallets
This combination of negative funding rates and whale distribution creates headwinds for any attempted breakout above resistance. Market structure analysts note that similar patterns preceded significant corrections in August 2024 and November 2024, when XRP declined 22% and 18% respectively following failed resistance tests accompanied by whale distribution.
Historical Context and Market Structure Implications
The current XRP resistance test occurs within a broader historical context that provides important perspective. XRP has traded within a defined range between $0.45 and $0.65 for approximately 14 months since January 2024, representing one of the longest consolidation periods in its history. This extended basing pattern follows the cryptocurrency’s legal clarity achieved in July 2023, when a U.S. court ruling determined that XRP itself is not necessarily a security.
Market technicians emphasize that extended consolidation periods typically precede significant directional moves. The duration of the current range suggests that a decisive breakout or breakdown could carry substantial momentum. Historical analysis reveals that XRP’s previous major consolidation phases lasted between 8 and 16 months before resolving in moves exceeding 100% in the direction of the breakout.
Several structural factors influence the current resistance test:
- Regulatory Environment: Ongoing SEC appeals create lingering uncertainty
- Adoption Metrics: RippleNet transaction volume increased 28% year-over-year
- Liquidity Conditions: XRP trading pairs represent 4.2% of total crypto volume
- Technical Development: XRP Ledger activity shows consistent growth
These fundamental factors create a complex backdrop against which the technical resistance test plays out. While adoption metrics and development activity provide underlying support, regulatory uncertainty and competitive pressures from other payment-focused cryptocurrencies create persistent headwinds that may contribute to resistance at key technical levels.
Expert Analysis: Institutional Perspective on the Resistance Zone
Financial institutions monitoring the cryptocurrency sector provide valuable insights into the XRP resistance test. JPMorgan’s blockchain and digital assets research team notes in their March 2025 report that “XRP faces significant technical resistance coinciding with regulatory uncertainty, creating a challenging environment for sustained upward momentum.” The report further highlights that institutional adoption of XRP for cross-border payments continues to grow, with transaction volume increasing quarter-over-quarter, but this fundamental strength has not yet translated into technical breakout momentum.
Similarly, analysis from Bloomberg Intelligence emphasizes the importance of the current resistance test for XRP’s market structure. Senior commodity strategist Mike McGlone stated in a March 17 research note that “XRP’s repeated failure at the $0.58 level suggests either accumulation before a breakout or distribution before further decline. The resolution of this technical battle will likely determine XRP’s trajectory through mid-2025.” This institutional perspective underscores the significance of the current price action, with major financial firms viewing the resistance test as a potential inflection point for the cryptocurrency.
Potential Scenarios and Risk Management Considerations
Traders and investors face several plausible scenarios as XRP tests daily resistance. The primary bullish scenario involves a decisive daily close above $0.58 with expanding volume, which would invalidate the current resistance zone and potentially trigger a move toward the next significant resistance around $0.68. Technical analysts note that such a breakout would require confirmation through follow-through buying and would likely coincide with a shift in futures positioning from negative to positive funding rates.
Conversely, the bearish scenario suggests that repeated rejection at resistance will eventually lead to a breakdown below the current range support near $0.48. This scenario gains credibility from the current whale distribution patterns and negative funding rates in derivatives markets. A breakdown below $0.48 would likely target the next significant support zone between $0.42 and $0.45, representing a potential 10-15% decline from current levels.
Risk management professionals emphasize several key considerations during this resistance test:
- Position Sizing: Reduced exposure during technical indecision
- Stop Placement: Below $0.48 for long positions, above $0.58 for shorts
- Confirmation Requirements: Daily close beyond range boundaries
- Timeframe Alignment: Weekly chart shows broader consolidation
These risk management principles reflect the heightened uncertainty surrounding the current XRP resistance test. Market participants generally agree that the resolution of this technical battle will provide clearer directional signals, but the timing and magnitude of any breakout or breakdown remain uncertain given the conflicting signals from derivatives markets and on-chain data.
Conclusion
The XRP resistance test at the $0.55-$0.58 zone represents a critical technical juncture for the cryptocurrency. Current market structure reveals conflicting signals, with concerning whale distribution patterns and negative funding rates contrasting against growing adoption metrics and extended consolidation that typically precedes significant moves. The resolution of this resistance test will likely determine XRP’s medium-term trajectory, with a decisive breakout potentially triggering substantial upward momentum while repeated rejection increases the probability of range breakdown. Market participants should monitor volume patterns, derivatives positioning, and on-chain whale activity for clues about the eventual resolution of this technical battle. The XRP resistance test therefore represents not merely a short-term trading consideration but a potential inflection point for the cryptocurrency’s broader market structure as it navigates complex technical, fundamental, and regulatory landscapes in 2025.
FAQs
Q1: What exactly is the key resistance level XRP is testing?
The key resistance zone for XRP currently spans from $0.55 to $0.58. This area represents a confluence of technical factors including the 200-day exponential moving average, horizontal resistance from previous price action, and a Fibonacci retracement level.
Q2: How does whale distribution affect XRP’s price action?
Whale distribution near resistance levels typically creates selling pressure that makes breakouts more difficult. Recent data shows addresses holding 10-50 million XRP have reduced holdings by approximately 120 million XRP during resistance tests, suggesting large holders view this zone as an exit opportunity.
Q3: What are negative funding rates in futures markets?
Negative funding rates occur when short position holders pay long position holders to maintain their positions. This typically indicates bearish sentiment among leveraged traders and often precedes or accompanies price declines or failed breakout attempts.
Q4: How long has XRP been trading in its current range?
XRP has traded primarily between $0.45 and $0.65 for approximately 14 months since January 2024. This represents one of the longest consolidation periods in XRP’s history and increases the potential significance of any eventual breakout or breakdown.
Q5: What would constitute a decisive breakout above resistance?
A decisive breakout would require a daily closing price above $0.58 with significantly higher than average trading volume. Technical analysts generally look for at least 3% clearance above resistance with volume confirmation to validate a breakout as legitimate rather than a false breakout.