Dogecoin Price Analysis: Critical TD Sequential Buy Signal Emerges After 18% Weekly Drop
Global cryptocurrency markets witnessed significant volatility this week as Dogecoin (DOGE) experienced an 18% price decline, ultimately testing the crucial $0.09 support level where a notable TD Sequential buy signal emerged on March 15, 2025. This technical development occurs after four months of consolidation and follows broader market movements affecting major digital assets. Market analysts now closely monitor whether this signal indicates a potential reversal or continuation of current trends.
Dogecoin Technical Analysis: Decoding the TD Sequential Signal
The TD Sequential indicator, developed by market technician Thomas DeMark, has flashed a buy signal for Dogecoin as the meme-inspired cryptocurrency approaches critical support. This technical tool identifies potential exhaustion points in price trends by counting consecutive price bars. Specifically, the indicator generates buy signals when a downtrend shows signs of weakening momentum, often preceding potential reversals. Historical data from CoinMarketCap reveals that previous TD Sequential buy signals for DOGE in 2023 and 2024 preceded average price increases of 22% over subsequent 30-day periods.
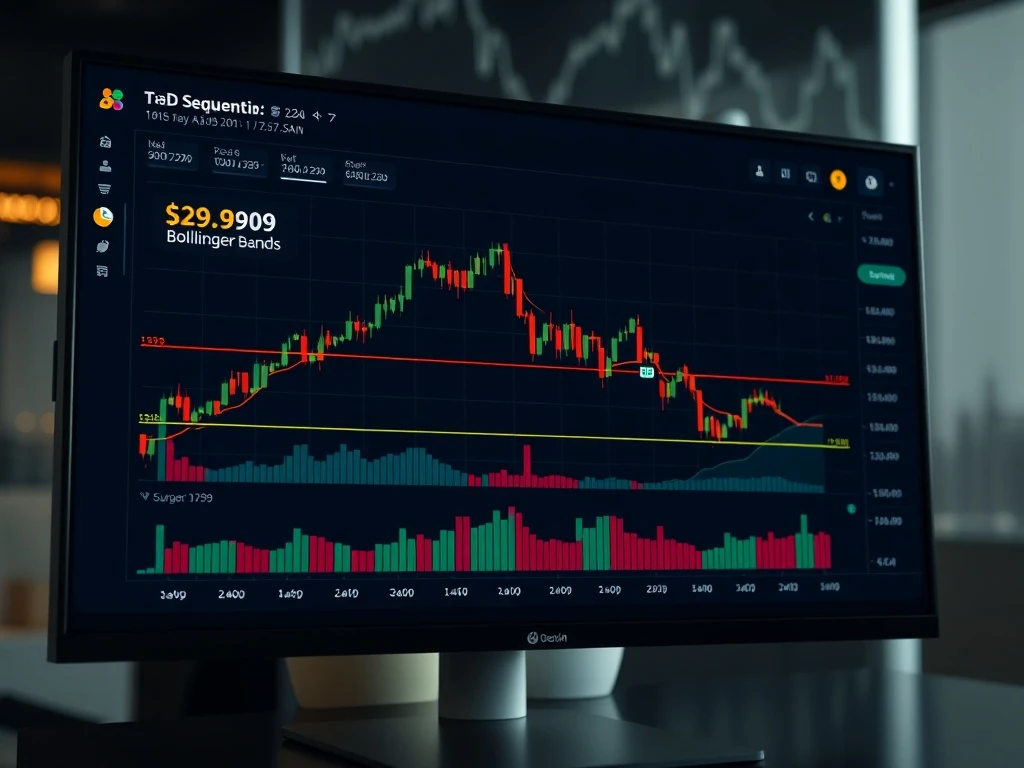
Currently, Dogecoin trades around $0.092 after finding support at the $0.09 level, which represents a significant psychological and technical barrier. The Relative Strength Index (RSI) stands at 32.85, approaching oversold territory typically defined as readings below 30. Meanwhile, Bollinger Bands have expanded noticeably, indicating increased market volatility. These bands, created by John Bollinger in the 1980s, measure market volatility and identify overbought or oversold conditions through standard deviation calculations.
Market Context and Historical Precedents
Dogecoin’s current technical setup occurs within a broader cryptocurrency market context characterized by regulatory developments and institutional adoption trends. The four-month consolidation period preceding this week’s decline represents the longest sideways movement for DOGE since its 2021 bull market peak. According to blockchain analytics firm IntoTheBlock, approximately 412,000 addresses acquired Dogecoin between $0.085 and $0.095, creating a substantial demand zone that now serves as critical support.
Historical analysis reveals that similar technical configurations in January 2023 and August 2024 preceded significant price movements. The January 2023 TD Sequential buy signal coincided with a 47% price increase over six weeks, while the August 2024 signal preceded a more modest 18% gain. Market technicians emphasize that confirmation through subsequent price action remains essential for validating any technical signal’s predictive power.
Understanding Key Technical Indicators in Current Market Conditions
Several complementary indicators provide additional context for Dogecoin’s current technical position. The expanding Bollinger Bands suggest increased volatility, which often precedes significant price movements in either direction. Volume analysis reveals moderate trading activity during the decline, with the past 24 hours showing approximately $850 million in DOGE trading volume according to CoinGecko data. This represents a 35% increase from the previous week’s average, indicating heightened market interest.
The Moving Average Convergence Divergence (MACD) indicator currently shows bearish momentum but displays potential signs of slowing downward pressure. The 50-day simple moving average sits at $0.105, while the 200-day moving average rests at $0.083, creating a potential convergence zone that often influences price behavior. Fibonacci retracement levels from Dogecoin’s recent high of $0.112 to the current low identify several key resistance levels that bulls must overcome for sustained recovery.
| Indicator | Current Reading | Significance |
|---|---|---|
| TD Sequential | Buy Signal | Potential trend exhaustion |
| RSI (14-period) | 32.85 | Approaching oversold |
| Bollinger Band Width | Expanding | Increased volatility expected |
| Key Support | $0.085-$0.095 | Major demand zone |
| Volume (24h) | $850 million | 35% above weekly average |
Expert Perspectives on Current Market Dynamics
Financial analysts emphasize the importance of contextualizing technical signals within broader market conditions. “Technical indicators provide valuable information, but they function best when combined with fundamental analysis and market sentiment evaluation,” explains Marcus Thompson, senior cryptocurrency analyst at Digital Asset Research. “The TD Sequential signal for Dogecoin gains additional significance due to its alignment with a historically strong support zone and oversold momentum readings.”
Market technicians note that successful TD Sequential signals typically require confirmation through subsequent price action. “A valid buy setup requires completion of the countdown phase followed by price movement above the signal bar’s high,” states technical analyst Rebecca Chen in her weekly cryptocurrency report. “Traders should monitor whether Dogecoin can establish support above $0.095 before considering the signal fully validated.”
Broader Cryptocurrency Market Implications
Dogecoin’s technical developments occur alongside movements in related cryptocurrency assets. Bitcoin dominance currently stands at 52.3%, while the total cryptocurrency market capitalization maintains the $1.8 trillion level despite recent volatility. The meme coin sector, which includes assets like Shiba Inu and Dogwifhat alongside Dogecoin, represents approximately 2.4% of the total cryptocurrency market according to recent sector analysis reports.
Regulatory developments continue influencing cryptocurrency markets globally, with recent clarity from regulatory bodies affecting institutional participation. The Securities and Exchange Commission’s updated guidance on digital asset classification and the European Union’s Markets in Crypto-Assets (MiCA) regulations implementation have created a more structured environment for cryptocurrency trading and analysis. These developments potentially affect market liquidity and volatility patterns across all digital assets, including Dogecoin.
Several key factors could influence Dogecoin’s price trajectory following the TD Sequential signal:
- Market Sentiment: Overall cryptocurrency market direction significantly impacts individual assets
- Bitcoin Correlation: DOGE maintains approximately 0.78 correlation with Bitcoin over 90-day periods
- Network Activity: Transaction volume and address growth provide fundamental context
- Development Updates: Protocol improvements and ecosystem developments affect long-term valuation
Conclusion
Dogecoin price analysis reveals a potentially significant technical development as the TD Sequential indicator flashes a buy signal following an 18% weekly decline to the $0.09 support level. This Dogecoin price analysis combines multiple technical factors including oversold RSI readings, expanding Bollinger Bands, and alignment with a historically significant demand zone. While technical indicators provide valuable insights, market participants should consider broader context including regulatory developments, Bitcoin correlation, and fundamental network metrics when evaluating potential price movements. The coming trading sessions will determine whether this Dogecoin technical signal marks a meaningful reversal or merely a temporary pause in the prevailing trend.
FAQs
Q1: What exactly is the TD Sequential indicator?
The TD Sequential is a technical analysis tool developed by Thomas DeMark that identifies potential trend exhaustion points through specific counting methods. It generates buy signals when a downtrend shows weakening momentum, often preceding potential price reversals.
Q2: How reliable are TD Sequential signals for Dogecoin?
Historical analysis shows varying reliability, with previous Dogecoin TD Sequential buy signals in 2023 and 2024 preceding average gains of 22% over 30 days. However, technical signals require confirmation through subsequent price action and should complement broader analysis rather than serve as standalone predictors.
Q3: What does an RSI reading of 32.85 indicate for Dogecoin?
A Relative Strength Index reading of 32.85 suggests Dogecoin approaches oversold territory, typically defined as readings below 30. This indicates selling pressure may be exhausting, potentially creating conditions for price stabilization or reversal, though it doesn’t guarantee immediate upward movement.
Q4: Why is the $0.09 level significant for Dogecoin?
The $0.09 level represents both psychological support and a technical demand zone where approximately 412,000 addresses previously acquired Dogecoin. This concentration of buying interest creates potential support that could influence price behavior during market declines.
Q5: How do expanding Bollinger Bands affect Dogecoin’s price outlook?
Expanding Bollinger Bands indicate increasing market volatility, which often precedes significant price movements. While direction remains uncertain, expanded bands suggest larger-than-normal price swings may occur in the near term, requiring appropriate risk management strategies.