Crypto Market Shows Remarkable Recovery: Bitcoin and Ethereum Surge Defies Extreme Fear Gauge
Global cryptocurrency markets demonstrated unexpected resilience this week, showing significant recovery with Bitcoin and Ethereum leading substantial gains. Despite persistent extreme fear readings on sentiment indicators, major digital assets recorded strong upward momentum throughout global trading sessions. This apparent contradiction between price action and market psychology presents a compelling case study for analysts tracking the 2025 digital asset landscape.
Crypto Market Recovery Defies Sentiment Indicators
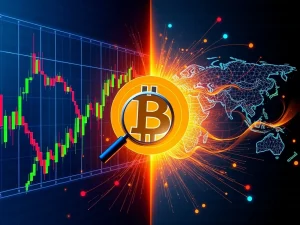
Market data from multiple exchanges confirms the crypto market shows significant recovery across major trading pairs. Bitcoin surged approximately 18% over seven days, breaking through key resistance levels that had persisted for weeks. Similarly, Ethereum recorded a 22% gain during the same period, outperforming Bitcoin on a percentage basis. These movements occurred while the Crypto Fear and Greed Index remained firmly in “extreme fear” territory, registering values between 10 and 15 throughout the rally.
This divergence between price action and sentiment metrics represents a notable market phenomenon. Typically, extreme fear readings correspond with selling pressure and declining prices. However, the current situation demonstrates how institutional accumulation and technical factors can override retail sentiment indicators. Market analysts point to several contributing factors for this unusual dynamic.
Technical Breakouts and Institutional Activity
Technical analysis reveals Bitcoin broke above its 50-day moving average for the first time in 45 days. This technical milestone triggered algorithmic buying from quantitative trading firms. Additionally, on-chain data shows significant accumulation by addresses holding between 100 and 10,000 BTC. These larger investors appear to have been accumulating during the fear period, positioning themselves for the eventual recovery.
DeFi Sector Shows Parallel Strength
The decentralized finance ecosystem demonstrated remarkable parallel strength during this recovery period. Total Value Locked across DeFi protocols increased by approximately $12 billion, reaching its highest level in three months. This growth occurred across multiple blockchain networks, with Ethereum maintaining its dominant position but alternative Layer 1 chains showing proportionally greater percentage increases.
Several key DeFi metrics illustrate the sector’s recovery:
- Lending protocol utilization increased by 28% as borrowing activity resumed
- DEX trading volumes surged 42% compared to the previous week
- Stablecoin market capitalization grew by $4 billion as capital returned
- Yield farming APYs increased across major liquidity pools
This DeFi recovery suggests sophisticated participants are returning to leverage opportunities despite the broader fear sentiment. The simultaneous strength in both spot markets and DeFi ecosystems indicates comprehensive market healing rather than isolated asset appreciation.
Analyzing the Fear and Greed Index Divergence
The Crypto Fear and Greed Index incorporates multiple data points to generate its sentiment readings. These include volatility, market momentum, social media sentiment, surveys, and dominance metrics. The index’s persistence in extreme fear territory despite price recovery suggests several underlying factors may be at play.
| Component | Reading | Impact on Index |
|---|---|---|
| Volatility | High | Negative |
| Market Momentum | Positive | Positive |
| Social Media Sentiment | Negative | Negative |
| Surveys | Cautious | Negative |
| Dominance | Stable | Neutral |
As the table illustrates, volatility and social media sentiment continue to weigh heavily on the index despite improving price action. This lag between market movements and sentiment indicators creates potential opportunities for informed investors who recognize the discrepancy. Historical analysis shows similar divergences have often preceded sustained rallies when fundamentals improve despite persistent fear.
Market Structure and Liquidity Factors
Exchange liquidity metrics provide additional context for understanding this recovery. Order book depth improved significantly during the rally, with bid-ask spreads tightening across major trading pairs. This suggests market makers are becoming more comfortable providing liquidity, reducing transaction costs for participants. Furthermore, futures funding rates normalized from negative to slightly positive, indicating balanced positioning between longs and shorts.
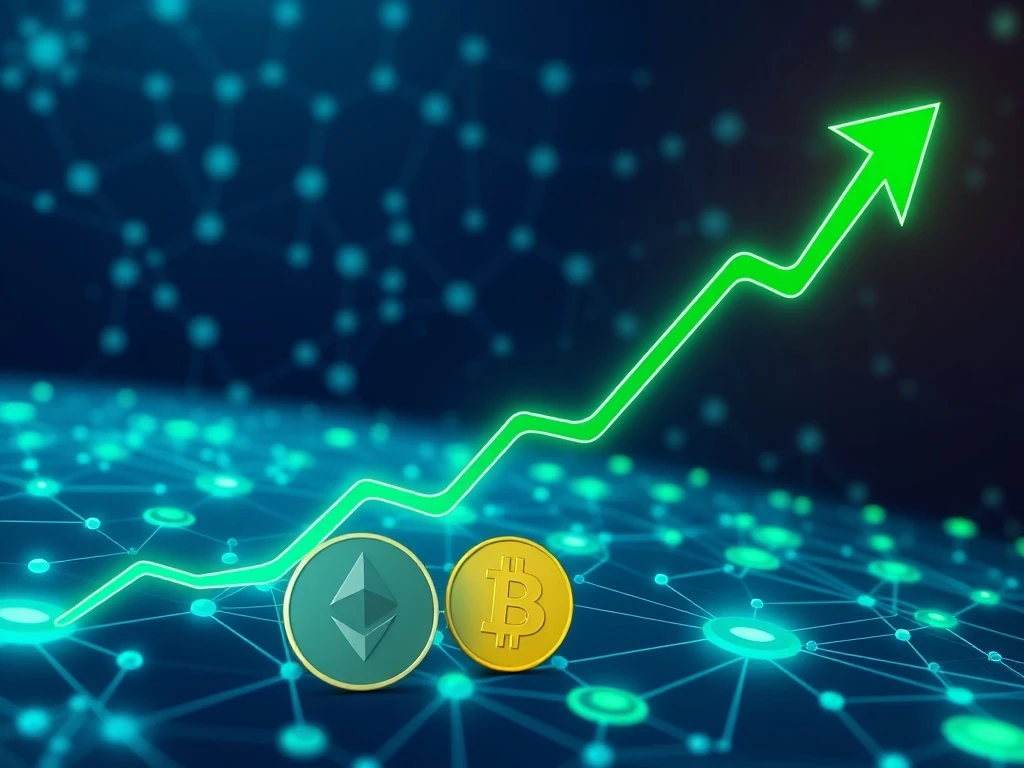
Bitcoin and Ethereum Lead the Recovery Charge
Bitcoin’s recovery to approximately $68,000 represents a crucial psychological level for market participants. The asset reclaimed its position above the 2024 cycle high, suggesting continued strength in the current market structure. On-chain metrics show decreasing exchange balances, indicating accumulation rather than distribution during the move higher.
Ethereum demonstrated even stronger performance, breaking above $3,800 with conviction. The Ethereum network processed over 1.2 million transactions daily during the recovery period, with gas fees remaining relatively stable despite increased activity. This suggests the network’s scalability improvements are effectively handling increased demand without creating congestion issues that plagued previous cycles.
Several factors contributed to Ethereum’s outperformance:
- Layer 2 adoption continues growing with record transaction volumes
- Staking participation reached new highs as validators increased
- Protocol upgrades implemented earlier this year improved efficiency
- Institutional interest in staking yields attracted new capital
Global Regulatory Context and Institutional Participation
The recovery occurs within an evolving global regulatory landscape. Several jurisdictions have clarified digital asset frameworks during recent months, providing greater certainty for institutional participants. Notably, major financial institutions in the United States and European Union have expanded their cryptocurrency offerings despite the fear sentiment prevailing among retail investors.
Institutional participation appears to be driving much of the current recovery. Data from regulated custody solutions shows increasing assets under management, particularly from pension funds and insurance companies allocating small percentages to digital assets. This institutional accumulation creates a more stable foundation for prices than purely retail-driven markets, potentially explaining the divergence from sentiment indicators.
Macroeconomic Factors Supporting Recovery
Broader macroeconomic conditions may be contributing to the crypto market recovery. With inflation showing signs of moderation in major economies, investors appear more willing to allocate to risk assets. Additionally, the potential for interest rate reductions in coming quarters has improved sentiment toward growth-oriented investments including digital assets. These macroeconomic tailwinds provide fundamental support for the technical recovery observed in cryptocurrency markets.
Conclusion
The crypto market shows significant recovery despite contradictory sentiment readings, presenting a complex but encouraging picture for digital asset investors. Bitcoin and Ethereum have led the charge with substantial gains, while DeFi metrics demonstrate parallel strength across multiple protocols. The divergence between price action and the Fear and Greed Index suggests sophisticated participants may be accumulating during periods of retail fear. As markets continue evolving in 2025, this recovery highlights the importance of analyzing multiple data dimensions beyond simple sentiment indicators when assessing market health and potential opportunities.
FAQs
Q1: Why is the crypto market recovering while fear indicators remain extreme?
The recovery appears driven by institutional accumulation and technical breakouts that override retail sentiment indicators. Larger investors have been accumulating during fear periods, creating buying pressure that pushes prices higher despite negative sentiment readings.
Q2: How significant is the current Bitcoin price surge?
Bitcoin’s approximately 18% gain over seven days represents its strongest weekly performance in three months. The move broke key technical resistance levels and brought the asset back above its 2024 cycle high, suggesting potential for continued strength.
Q3: What does DeFi TVL growth indicate about market recovery?
Increasing Total Value Locked in DeFi protocols suggests capital is returning to yield-generating activities within the ecosystem. This indicates confidence in smart contract platforms and suggests the recovery extends beyond simple spot price appreciation.
Q4: Could this recovery be a temporary rally rather than sustained growth?
While possible, several factors suggest this may be more than a temporary rally. Institutional participation, improving technical structure, and macroeconomic conditions provide fundamental support that wasn’t present during previous false recoveries.
Q5: How should investors interpret the Fear and Greed Index during this divergence?
Investors should consider the index as one data point among many rather than a definitive market timing tool. Historical analysis shows sentiment indicators often lag price action during transitional periods, potentially creating opportunities for those who recognize the discrepancy.