Bitcoin Price Prediction: Deciphering the Rally After a Brutal Crypto Sell-Off
Global cryptocurrency markets experienced a dramatic reversal on Friday, October 10, 2025, as Bitcoin and major altcoins staged a strong double-digit rebound from weekly lows. This sharp recovery follows a brutal sell-off that pushed the Crypto Fear & Greed Index to its lowest point in over three years, sparking intense debate among traders: is this the start of a sustained recovery or merely a temporary dead cat bounce? Technical analysis of Bitcoin (BTC), Ethereum (ETH), and other top cryptocurrencies now provides critical clues for the market’s next directional move.
Bitcoin Price Prediction and Market Context
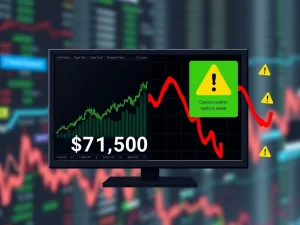
Bitcoin’s price action dominated headlines last week, with the flagship cryptocurrency plunging to a critical support level near $60,000. This decline represented a significant test for the bull market structure that had been in place for most of 2025. The subsequent sharp rebound above $69,000 indicates substantial buying interest at lower price points, a phenomenon noted by several market observers. Veteran trader Peter Brandt commented on the nature of the sell-off, suggesting it exhibited patterns characteristic of coordinated campaign selling rather than retail investor panic. Meanwhile, the weekly Relative Strength Index (RSI) falling below 30—an event with only four historical precedents—offers a statistical ray of hope for bulls, having previously preceded an average one-month return of over 23%.
The immediate technical battleground for BTC is clearly defined. The $74,508 level, which previously acted as support before Wednesday’s breakdown, now serves as a crucial resistance zone. A daily close above this level would signal a potential invalidation of the recent bearish breakdown and open the door for a test of the 20-day Exponential Moving Average near $80,900. Conversely, failure to reclaim $74,508 would suggest bearish control remains intact, increasing the probability of a retest of the $60,000 support floor. The market’s sentiment, as quantified by the extreme fear reading, often coincides with potential inflection points, making the current setup particularly significant for medium-term direction.
Altcoin Technical Analysis and Relief Rally Prospects
Ethereum mirrored Bitcoin’s volatility, finding a foothold at the $1,750 support after breaking below its own key level at $2,111. The ETH/USDT pair’s recovery attempt now faces its first major hurdle at this same $2,111 breakdown point. A rejection here would signal that sellers remain in command, potentially leading to a deeper correction toward $1,537. Successfully reclaiming $2,111, however, could catalyze a move toward the 20-day EMA at $2,569. Other major altcoins present varied technical pictures. BNB’s plunge to $570 pushed its RSI deeply into oversold territory, suggesting a near-term bounce is plausible, though sustained recovery requires a swift move back above $730.
Solana’s chart shows a dramatic fall to the $67.50 level, breaking the $95 support. Its oversold RSI also hints at a corrective bounce, with $95 now acting as a primary resistance target for any relief rally. XRP exhibited noteworthy price action, briefly breaking below the support line of its descending channel and the $1.25 low before bulls aggressively bought the dip, pushing it back into the channel pattern. This sets up a confrontation at the 20-day EMA near $1.71. The performance of these major assets during the rebound phase will be instrumental in determining whether the current uptick has lasting power or represents a selling opportunity for sidelined bears.
Expert Insights and On-Chain Sentiment
The extreme market conditions have elicited analysis focusing on both technical indicators and broader market mechanics. The plunge in the Crypto Fear & Greed Index to a score of 9—a level of fear not seen since the bear market lows of June 2022—is a contrarian signal often watched by experienced investors. Furthermore, the distinction made by analysts between ‘campaign selling’ and retail liquidation is crucial. Campaign selling implies larger, strategic distribution, which can have different implications for the duration and depth of a correction compared to panic-driven retail selling. This context adds a layer of sophistication to the standard technical readings, suggesting traders should consider the source and nature of the selling pressure alongside chart patterns.
Mid-Cap and Privacy Coin Forecasts
Beyond the top five cryptocurrencies, several other digital assets present compelling technical setups. Cardano (ADA) witnessed a break below its descending channel support, though the long lower wick on Friday’s candlestick indicates immediate buying interest. Its path hinges on sustaining above this broken trendline for a potential move to the 20-day EMA at $0.32. Dogecoin remains under significant pressure, with its bounce attempt from $0.08 likely to face stiff selling at the 20-day EMA near $0.11. A failure here risks a decline toward the $0.07 support level.
Bitcoin Cash (BCH) shows a similar story of breakdown and rebound, with the $443 level acting as a pivotal support. Monero (XMR), a leading privacy coin, broke below the $360 support and now faces overhead resistance at the 38.2% Fibonacci retracement level near $361. In contrast, Hyperliquid (HYPE) displays relative strength, maintaining position near its 20-day EMA and attempting to challenge the $35.50 resistance, suggesting a more bullish structure may be intact for this asset compared to its peers. The divergent behavior across market caps highlights the selective nature of the current buying.
| Cryptocurrency | Key Support | Key Resistance | 20-Day EMA |
|---|---|---|---|
| Bitcoin (BTC) | $60,000 | $74,508 | $80,899 |
| Ethereum (ETH) | $1,750 | $2,111 | $2,569 |
| BNB (BNB) | $570 | $730 | $798 |
| Solana (SOL) | $67.50 | $95 | $110 |
| XRP (XRP) | $1.25 | $1.71 (20-day EMA) | $1.71 |
Conclusion
The recent Bitcoin price prediction scenario and altcoin rebounds have injected volatility and uncertainty into the cryptocurrency market. While oversold technical conditions have clearly triggered a relief rally, the sustainability of this move remains unconfirmed. The collective challenge for Bitcoin and major altcoins is to reclaim their recent breakdown levels, transforming them from resistance back into support. Failure to do so would validate the bearish breakdowns and likely lead to a consolidation phase or further downside. Traders and investors should monitor these key technical levels closely, as the market’s reaction at these points will provide the clearest evidence of whether the current bounce is a fleeting recovery or the foundation of a more substantial trend reversal. As always, thorough personal research and risk management are paramount in such a volatile environment.
FAQs
Q1: What is a ‘dead cat bounce’ in cryptocurrency markets?
A dead cat bounce is a temporary, short-lived recovery in the price of a declining asset, followed by a continuation of the downtrend. It is often seen as a trap for buyers who mistake the bounce for a true reversal.
Q2: Why is the $74,508 level so important for Bitcoin’s price prediction?
The $74,508 level was a major support zone that Bitcoin broke below during the sell-off. In technical analysis, former support often becomes new resistance. A successful reclaim above this level is needed to invalidate the recent bearish breakdown.
Q3: What does the Crypto Fear & Greed Index measure?
The Crypto Fear & Greed Index is a sentiment indicator that quantifies emotions and psychology in the cryptocurrency market from 0 (Extreme Fear) to 100 (Extreme Greed). It is compiled from volatility, market momentum, social media, surveys, and dominance data.
Q4: How reliable is the RSI (Relative Strength Index) for predicting crypto price turns?
The RSI is a momentum oscillator that identifies overbought (above 70) and oversold (below 30) conditions. While it is a useful tool, especially at extreme readings, it is not a standalone predictor. It should be used in conjunction with other technical indicators, trend analysis, and market context for more reliable signals.
Q5: What is the significance of the 20-day Exponential Moving Average (EMA)?
The 20-day EMA is a widely watched short-term trend indicator. Prices trading above it suggest a bullish short-term bias, while prices below it indicate bearish momentum. It often acts as dynamic support in uptrends and dynamic resistance in downtrends.