Bitcoin Price Plummets: Stunning $69K Collapse Erases 15 Months of Bull Market Gains

In a dramatic market reversal on Thursday, February 6, 2025, the Bitcoin price collapsed below the critical $70,000 threshold, effectively wiping out fifteen months of hard-won bull market gains and sending shockwaves through global cryptocurrency markets. This significant downturn represents the first time Bitcoin has traded below its 2021 bull market peak since November 2024, marking a pivotal moment for digital asset investors worldwide.
Bitcoin Price Enters Critical Support Zone
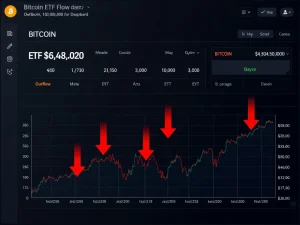
Market data from TradingView confirmed Bitcoin reached new 15-month lows of $69,100 on the Bitstamp exchange during Asian trading hours. This precipitous drop triggered substantial market reactions across multiple trading platforms. Consequently, the cryptocurrency experienced approximately $130 million in long position liquidations within just four hours, according to real-time data from monitoring resource CoinGlass. These liquidations amplified selling pressure throughout derivative markets.
Simultaneously, the negative Coinbase Premium Index reached its lowest point in over a year. This metric, which tracks the price difference between Coinbase’s BTC/USD pair and Binance’s BTC/USDT pair, indicates significantly weaker buying demand from U.S. institutional investors. Nic Puckrin, CEO of Coin Bureau, emphasized this trend, noting the premium fell even lower than levels observed after significant regulatory changes in late 2024.
Coordinated Selling Pressure and Market Mechanics
Multiple market analysts identified patterns suggesting coordinated institutional selling. Veteran trader Peter Brandt publicly described the activity as “campaign selling,” implying large entities are systematically unloading Bitcoin holdings according to a predetermined schedule. Crypto entrepreneur Alistair Milne supported this analysis on social media platform X, stating, “Someone enormous is unloading to a deadline.” He compared the current pressure to previous government-led Bitcoin distributions.
Charles Edwards, founder of Capriole Investments, observed that long-term Bitcoin holders, or “OG whales,” continued selling aggressively despite the price decline. He noted their behavior resembled activity typically seen at all-time highs rather than during corrections. This persistent selling from foundational market participants created substantial overhead resistance that prevented price recovery.
Precious Metals Correlation and Macro Context
Bitcoin’s decline mirrored sudden volatility in traditional safe-haven assets. Gold, which had briefly recovered to $5,100 per ounce, plummeted to $4,789 before attempting to reclaim the $5,000 level. Silver exhibited even more extreme volatility, swinging between $90 and $73 per ounce within the same trading session. This correlation suggests broader macroeconomic factors, possibly including interest rate expectations or geopolitical tensions, are influencing multiple asset classes simultaneously.
The synchronized movement between cryptocurrencies and precious metals indicates increasing integration of digital assets within global financial systems. Market participants now frequently analyze Bitcoin alongside traditional inflation hedges, creating new intermarket dynamics that can amplify volatility during periods of financial stress.
Technical Analysis and Key Support Levels
Technical analysts immediately identified several critical support zones following the breakdown. The $69,000 level represents psychological support, but more importantly, the area directly below contains the 200-week exponential moving average (EMA). This long-term trend indicator has historically provided substantial support during previous bear markets. A decisive break below this level could signal further declines toward the $50,000 region, which multiple traders identified as a potential bottom target.
Trader CW warned on social media, “$BTC has entered a key support zone. If it fails to support the 69k level, another significant decline could occur.” This sentiment reflects broader market concern about whether current levels can sustain buying interest. The chart structure shows Bitcoin has broken below its consolidation range from late 2024, increasing the probability of continued downward momentum.
| Level | Type | Significance |
|---|---|---|
| $72,000 | Resistance | Previous consolidation floor |
| $69,000 | Support | Psychological & technical level |
| 200-week EMA | Support | Long-term trend indicator (~$67,500) |
| $50,000 | Support | Major historical accumulation zone |
Market Impact and Future Implications
The rapid price decline has several immediate consequences for cryptocurrency markets. First, leveraged traders experienced significant losses, potentially reducing overall market liquidity. Second, institutional investors may reassess their allocation strategies given the increased volatility. Third, regulatory scrutiny often intensifies following major market movements, potentially affecting future policy decisions.
Despite the bearish short-term outlook, some analysts maintain longer-term optimism. Historical patterns show Bitcoin has experienced similar corrections during previous bull markets, often consolidating before resuming upward trajectories. The fundamental adoption metrics, including institutional custody solutions and regulatory frameworks, continue developing independently of price action.
Liquidation Dynamics and Risk Management
The $130 million liquidation event highlights the risks associated with leveraged cryptocurrency trading. Exchange platforms automatically close positions when collateral values fall below maintenance margins, creating cascading sell orders that exacerbate price declines. Risk management protocols become particularly crucial during such volatile periods. Experienced traders typically reduce leverage exposure when volatility indicators reach extreme levels.
Market structure analysis reveals that liquidation clusters often form around round-number price levels like $70,000. These clusters create temporary support or resistance zones as automated trading systems react to price thresholds. Understanding these mechanical aspects helps traders navigate high-volatility environments more effectively.
Conclusion
The Bitcoin price collapse below $70,000 represents a significant technical and psychological event for cryptocurrency markets. By erasing fifteen months of bull market gains, this movement has reset market expectations and introduced substantial uncertainty. The coordinated selling pressure from large holders, combined with correlation to traditional markets and technical breakdowns, suggests continued volatility in the near term. Market participants should monitor the 200-week EMA closely, as a failure to hold this level could trigger further declines toward $50,000. Despite current bearish sentiment, Bitcoin’s long-term adoption trajectory remains distinct from short-term price action, reminding investors that cryptocurrency markets frequently experience dramatic corrections within broader growth trends.
FAQs
Q1: What caused Bitcoin to drop below $70,000?
Multiple factors contributed including coordinated institutional selling, liquidations of leveraged positions, correlation with precious metals volatility, and technical breakdown below key support levels. Market analysts observed patterns suggesting large entities were systematically selling according to a predetermined schedule.
Q2: How significant is the $69,000 support level?
The $69,000 level represents both psychological support and a technical threshold. More importantly, the 200-week exponential moving average resides just below this price, which has historically provided substantial long-term support during previous market cycles.
Q3: What are the potential price targets if support fails?
Several traders identified the $50,000 region as a potential bottom target if Bitcoin breaks decisively below the 200-week EMA. This area represents a major historical accumulation zone where significant buying interest emerged during previous market cycles.
Q4: How does this decline compare to previous Bitcoin corrections?
While substantial, similar corrections have occurred during previous bull markets. Bitcoin frequently experiences 30-40% drawdowns within broader uptrends. The current decline remains within historical parameters, though its speed and correlation with traditional markets are notable.
Q5: What should investors monitor in coming weeks?
Key indicators include the 200-week EMA holding as support, changes in the Coinbase Premium Index signaling renewed U.S. institutional demand, reduction in selling pressure from long-term holders, and decoupling from precious metals volatility. Exchange flow data will also reveal whether accumulation is occurring at lower price levels.