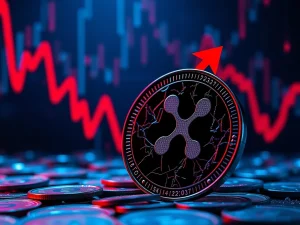
XRP Traders Defy Market Gloom: Remarkable Optimism Emerges as Bitcoin and Ethereum Sentiment Sours
In a surprising market divergence, XRP traders demonstrate remarkable resilience and optimism while Bitcoin and Ethereum sentiment plummets to bearish extremes, according to comprehensive social media analysis from Santiment. This sentiment split emerges during a significant cryptocurrency market downturn that has pushed Bitcoin toward critical support levels near $70,000. The contrasting emotional landscapes among cryptocurrency communities reveal deeper market dynamics and trader psychology that could signal important shifts in the digital asset ecosystem.
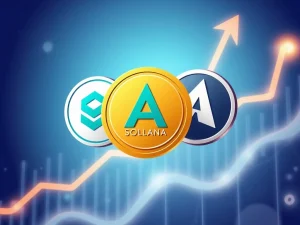
XRP Defies Bearish Crypto Market Sentiment
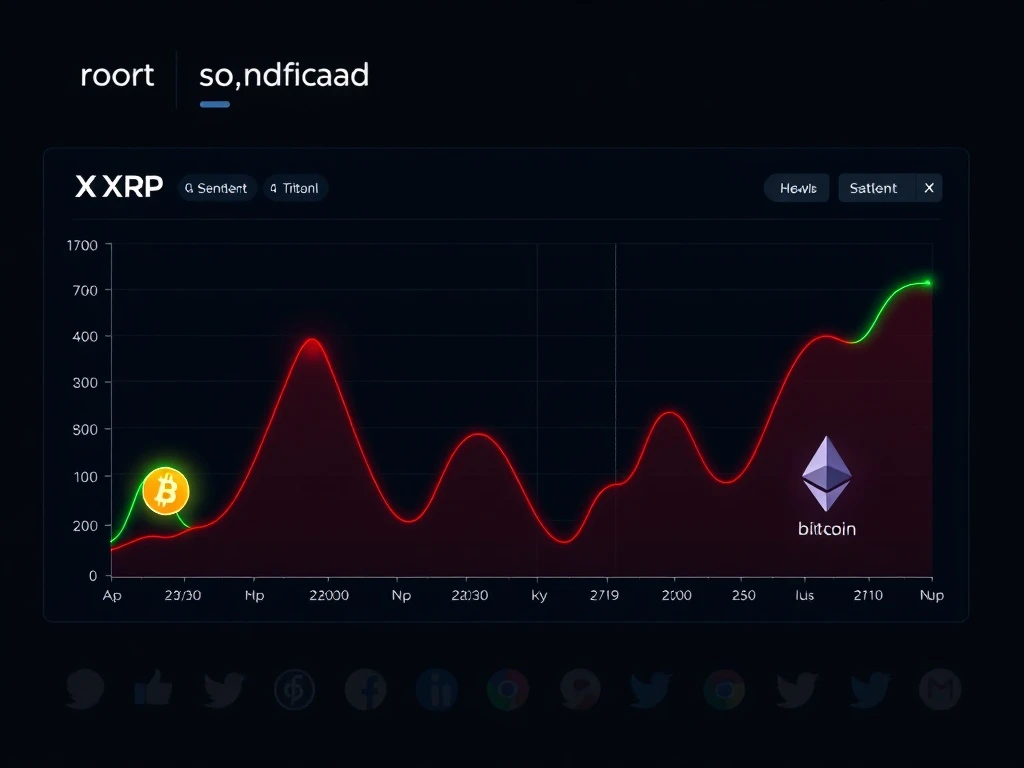
Social media platforms reveal a fascinating divergence in cryptocurrency trader psychology this week. While overall market sentiment has turned negative, XRP communities maintain notably higher optimism levels. Santiment’s proprietary Positive/Negative sentiment indicator, which measures social media mention ratios, shows XRP scoring 2.19—significantly higher than Ethereum’s 1.08 and Bitcoin’s 0.80. This represents a 103% advantage over Ethereum and a substantial 173% lead over Bitcoin in positive sentiment metrics.
Analysts observe this divergence despite XRP experiencing greater price declines than either Bitcoin or Ethereum over the past week. According to CoinMarketCap data, XRP has fallen 6.82% over seven days, while Bitcoin declined 4.97% and Ethereum dropped 4.92%. This counterintuitive relationship between price performance and trader sentiment suggests unique dynamics within the XRP ecosystem. Market observers note that XRP holders historically demonstrate different emotional responses to volatility compared to other cryptocurrency communities.
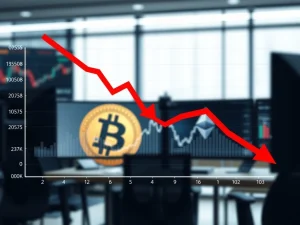
Bitcoin and Ethereum Enter Extreme Bearish Territory
Bitcoin and Ethereum sentiment has deteriorated dramatically according to multiple measurement tools. Santiment’s analysis indicates both leading cryptocurrencies have entered “extremely bearish” territory on social media platforms. This sentiment shift follows a major market downswing that began in early March 2025. The decline represents the most significant negative sentiment reading for both assets since December 2024, suggesting growing trader anxiety about near-term market prospects.
Alternative.me’s Crypto Fear & Greed Index, a widely followed market sentiment gauge, registered an “Extreme Fear” score of 12 this week. This represents the lowest reading since December 16, 2024, indicating widespread investor caution. The index considers multiple factors including volatility, market momentum, social media sentiment, and trading volume to generate its composite score. Historically, extreme fear readings have sometimes preceded market rebounds, though correlation doesn’t guarantee future outcomes.
Expert Analysis of Market Psychology
Pav Hundal, lead analyst at Swyftx, provides crucial context for understanding these sentiment divergences. “XRP holders wear volatility differently,” Hundal explained to CryptoNewsInsights. “XRP doesn’t move wildly outside the bounds of the rest of the market, but its community demonstrates unwavering faith in the asset’s fundamentals.” This fundamental confidence, according to Hundal, makes XRP traders less skeptical during market drawdowns compared to Bitcoin and Ethereum investors.
Hundal further contextualizes the current market environment by noting XRP remains down 35.5% over the past 30 days. “The coming weeks look tough,” he cautioned, while acknowledging the potential for sentiment-driven market movements. This expert perspective helps explain why XRP sentiment remains relatively robust despite significant price declines. The analysis suggests different investor profiles and time horizons across cryptocurrency communities.
Market Indicators Signal Broader Caution
Multiple technical and sentiment indicators confirm the cautious market environment. The CoinMarketCap Altcoin Season Index currently registers 32 out of 100, firmly in “Bitcoin Season” territory. This metric suggests investors continue favoring Bitcoin over riskier alternative cryptocurrencies during uncertain market conditions. Historically, readings below 25 indicate strong Bitcoin dominance, while readings above 75 suggest altcoin season conditions.
Additional market data reveals several concerning trends:
- Declining trading volumes across major exchanges
- Increased stablecoin holdings among institutional investors
- Reduced leverage in cryptocurrency derivatives markets
- Higher-than-average exchange inflows suggesting potential selling pressure
These indicators collectively paint a picture of defensive positioning across cryptocurrency markets. However, experienced traders note that extreme sentiment readings often precede market reversals, creating potential opportunities for contrarian investors.
Potential for Short-Term Market Relief
Despite the overwhelmingly bearish sentiment, some analysts see potential for near-term market improvement. Santiment’s research team suggests current conditions might support a short-term relief rally. “There remains a strong argument for a short-term relief rally as long as the small trader crowd continues to show disbelief toward cryptocurrency as a whole,” the analytics platform noted in its analysis.
This perspective aligns with historical market patterns where extreme negative sentiment precedes price rebounds. The reasoning follows behavioral finance principles: when most market participants become excessively pessimistic, selling pressure often exhausts itself, creating conditions for upward price movements. However, analysts caution that sentiment indicators should complement rather than replace fundamental and technical analysis.
Institutional Perspectives on Market Cycles
Matt Hougan, Bitwise chief investment officer, offers a broader perspective on current market conditions. In a recent social media post, Hougan observed that “Crypto Twitter has only just realized we’re in a full-blown crypto winter.” He further noted, “We have been in a crypto winter since January 2025. Chances are, we’re closer to the end than the beginning.”
This institutional viewpoint suggests professional investors recognized the market downturn earlier than retail participants. Hougan’s comments imply that the current negative sentiment might represent a late-stage reaction to conditions that have existed for months. This timing difference between institutional and retail awareness could have important implications for market dynamics in coming months.
Comparative Sentiment Analysis Table
| Cryptocurrency | Sentiment Score | 7-Day Price Change | 30-Day Performance | Market Position |
|---|---|---|---|---|
| XRP (XRP) | 2.19 (Positive) | -6.82% | -35.5% | 6th by Market Cap |
| Ethereum (ETH) | 1.08 (Neutral-Bearish) | -4.92% | -28.3% | 2nd by Market Cap |
| Bitcoin (BTC) | 0.80 (Bearish) | -4.97% | -22.1% | 1st by Market Cap |
This comparative analysis reveals the counterintuitive relationship between price performance and social media sentiment. XRP demonstrates the most positive sentiment despite the worst recent price performance among the three major cryptocurrencies. This divergence highlights the importance of considering multiple data points when assessing market conditions and potential future movements.
Historical Context and Market Psychology
Current sentiment patterns find parallels in previous market cycles. During the 2018-2019 cryptocurrency winter, similar sentiment divergences emerged between different cryptocurrency communities. Bitcoin maximalists maintained relatively higher optimism during that period despite significant price declines. The current XRP sentiment resilience might reflect similar community dynamics, where long-term believers maintain confidence during market downturns.
Behavioral finance research suggests several psychological factors might explain these sentiment patterns:
- Confirmation bias: Investors seek information confirming existing beliefs
- Endowment effect: Overvaluing assets already owned
- Narrative adherence: Commitment to particular investment stories
- Community reinforcement: Social validation within specific cryptocurrency groups
These psychological factors help explain why different cryptocurrency communities can develop substantially different sentiment profiles despite exposure to similar market conditions. Understanding these dynamics provides valuable context for interpreting sentiment data and making informed investment decisions.
Conclusion
The remarkable divergence between XRP optimism and Bitcoin/Ethereum bearish sentiment reveals complex market dynamics within the cryptocurrency ecosystem. While overall market conditions remain challenging, with multiple indicators signaling investor caution, the XRP community’s resilience suggests deeper fundamental confidence that transcends short-term price movements. This sentiment analysis provides valuable insights for traders and investors navigating current market conditions, emphasizing the importance of considering both quantitative data and qualitative community dynamics when assessing cryptocurrency opportunities. As the market continues evolving, monitoring these sentiment divergences will remain crucial for understanding potential turning points and investment opportunities.
FAQs
Q1: What does Santiment’s Positive/Negative sentiment indicator measure?
Santiment’s indicator measures the ratio of positive to negative social media mentions for specific cryptocurrencies, providing quantitative insight into trader sentiment and community mood across various platforms.
Q2: Why is XRP sentiment more positive despite worse price performance?
Analysts suggest XRP holders demonstrate stronger fundamental conviction and different psychological responses to volatility, maintaining optimism based on long-term prospects rather than short-term price movements.
Q3: How reliable are social media sentiment indicators for cryptocurrency trading?
While valuable for understanding market psychology, sentiment indicators work best when combined with technical analysis, fundamental research, and broader market context rather than as standalone trading signals.
Q4: What is the Crypto Fear & Greed Index and how is it calculated?
The index combines multiple factors including volatility, market momentum, social media sentiment, surveys, and trading volume to generate a composite score from 0 (extreme fear) to 100 (extreme greed).
Q5: Could current bearish sentiment lead to a market rebound?
Historical patterns suggest extreme negative sentiment sometimes precedes market recoveries, as selling pressure exhausts itself, but sentiment alone doesn’t guarantee specific price movements or timing.