Crypto Assets Enter Crucial Accumulation Zone as Market Pullback Deepens, Reveals New Report

DUBAI, United Arab Emirates – February 2, 2026 – A significant market development is unfolding as several major cryptocurrency assets have entered a critical accumulation zone, according to a comprehensive new analytical report from the Phoenix Group. This development coincides with a deepening market pullback that has captured the attention of institutional and retail investors worldwide. The report, released today, provides a data-intensive analysis of on-chain metrics and trading patterns, suggesting a potential inflection point for the digital asset market.
Crypto Assets Enter a Defined Accumulation Zone
The Phoenix Group’s February 2026 report identifies a clear shift in market structure for several large-cap digital assets. Consequently, analysts define an accumulation zone as a price range where sustained buying interest emerges despite prevailing negative sentiment. This activity often occurs below key long-term moving averages. The report specifically highlights Bitcoin (BTC), Ethereum (ETH), and select Layer-1 tokens as assets demonstrating these characteristics. Historically, such phases have preceded substantial price recoveries, as evidenced by data from previous market cycles in 2018-2019 and 2022-2023.
Furthermore, the analysis relies on multiple converging indicators. These include Net Unrealized Profit/Loss (NUPL) shifting into negative territory, an increase in the number of long-term holders, and a notable rise in exchange outflows. For instance, Bitcoin’s 200-day moving average currently acts as a key resistance level, while prices trade approximately 25% below their recent cycle highs. This creates a scenario where value-oriented investors are increasingly active.
Understanding the Deepening Market Pullback
The current market pullback began in late January 2026, triggered by a combination of macroeconomic and sector-specific factors. Firstly, renewed concerns about global liquidity conditions have pressured risk assets broadly. Secondly, regulatory announcements from several major economies introduced short-term uncertainty. Thirdly, profit-taking from the Q4 2025 rally contributed to downward momentum. The total cryptocurrency market capitalization has declined by approximately 18% from its peak, aligning with a typical corrective phase within a broader bull market structure.
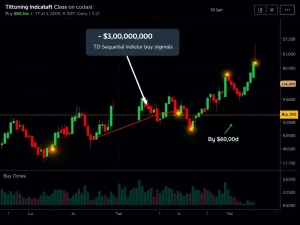
This correction has manifested across different asset classes within crypto. The table below illustrates the peak-to-trough drawdowns for key assets as of February 1, 2026:
| Asset | Drawdown from Peak | Key Support Level |
|---|---|---|
| Bitcoin (BTC) | -22% | $58,000 – $60,000 |
| Ethereum (ETH) | -28% | $3,200 – $3,400 |
| Solana (SOL) | -35% | $95 – $105 |
| Avalanche (AVAX) | -32% | $32 – $35 |
Notably, the pullback has been accompanied by rising trading volumes, which analysts interpret as a sign of capitulation. This often marks a local bottom. The Phoenix Group report emphasizes that current volatility remains within historical norms for the asset class.
Expert Analysis from Phoenix Group
The Phoenix Group, a leading digital asset research and investment firm headquartered in Dubai, bases its conclusions on proprietary data models. Their team of quants and market strategists monitors real-time on-chain data, derivatives positioning, and liquidity flows. “Our models are flashing signals consistent with prior accumulation phases,” stated the report’s lead analyst, whose commentary was included in the document. “We are observing entities often classified as ‘smart money’ – including large-scale holders and certain institutions – increasing their holdings at these levels, while weaker hands are exiting.”
The firm’s methodology cross-references several metrics:
- MVRV Z-Score: This metric, which compares market value to realized value, has dipped into undervalued territory.
- Supply in Profit: The percentage of circulating supply in profit has fallen sharply, reducing sell-side pressure.
- Exchange Reserves: A sustained decline in assets held on centralized exchanges indicates a reduction in immediately sellable supply.
This multi-faceted approach provides a robust framework for identifying market phases. The report cautions, however, that accumulation zones can persist for weeks or months and do not guarantee an immediate price reversal.
Historical Context and Market Cycle Parallels
Examining previous cycles offers crucial context for the current accumulation zone. For example, the 2018-2019 bear market saw Bitcoin consolidate between $3,000 and $4,000 for nearly five months. This period was later identified as a prime accumulation phase before the 2020-2021 bull run. Similarly, the market structure in late 2022 featured a prolonged period of sideways price action below $20,000, which set the stage for the 2023 recovery.
The current environment differs in key aspects, primarily due to increased institutional participation and mature derivatives markets. Nevertheless, the psychological pattern of fear and opportunity remains consistent. The Phoenix Group report draws a direct parallel to the Q3 2023 period, where similar on-chain signals preceded a 150%+ rally in Bitcoin’s price over the following nine months. This historical precedent provides a framework for understanding potential outcomes, though past performance is never a guarantee of future results.
Potential Impacts and Forward-Looking Scenarios
The identification of an accumulation zone carries significant implications for different market participants. For long-term investors, it may represent a strategic dollar-cost averaging opportunity. For traders, it highlights critical support levels to monitor. The report outlines two primary forward-looking scenarios based on current data. The base case scenario (60% probability) anticipates a period of continued consolidation within the defined range, followed by a gradual resumption of the uptrend in Q2 2026. The alternative scenario (40% probability) involves a deeper, but brief, washout below current supports before a stronger recovery materializes.
Market sentiment, as measured by the Crypto Fear & Greed Index, has recently plunged into “Extreme Fear” territory. Historically, this has been a reliable contrary indicator. The combination of negative sentiment, improving fundamentals for many blockchain networks, and strategic buying creates a complex but potentially opportunistic backdrop. The report concludes that while short-term volatility may continue, the risk-reward profile for core assets has improved markedly.
Conclusion
The Phoenix Group’s February 2026 analysis presents a compelling case that major crypto assets are navigating a critical accumulation zone amid a deepening market pullback. This phase is characterized by strategic buying from committed investors despite prevailing negative sentiment. While market conditions remain fluid and subject to external shocks, the convergence of on-chain data, historical cycle analysis, and valuation metrics suggests a period of heightened opportunity for informed market participants. The coming weeks will be crucial in determining whether this accumulation phase solidifies as a foundational base for the next leg of market growth.
FAQs
Q1: What exactly is an “accumulation zone” in cryptocurrency markets?
An accumulation zone is a price range where informed or long-term investors consistently purchase an asset, often during a period of negative sentiment or price decline. This activity builds a base of support and can precede a significant price advance.
Q2: Who is the Phoenix Group and why is their report significant?
The Phoenix Group is a prominent digital asset research and investment firm based in Dubai. Their reports are significant due to their data-driven methodology, focus on on-chain analytics, and reputation for institutional-grade analysis, lending authority to their market phase identifications.
Q3: Does entering an accumulation zone guarantee that prices will go up immediately?
No, it does not guarantee an immediate price increase. Accumulation zones can last for extended periods. They indicate a higher probability of a future upward move based on supply and demand dynamics, but timing remains uncertain.
Q4: What are the key indicators that analysts use to identify an accumulation zone?
Key indicators include a decline in exchange reserves (assets moving to cold storage), an increase in the number of long-term holders, negative shifts in profit/loss metrics like NUPL, and sustained buying volume at specific support levels.
Q5: How should a typical investor react to news about an accumulation zone?
A typical investor should treat this as informational context, not a direct signal to act. It may inform a long-term dollar-cost averaging strategy or prompt closer monitoring of market structure. Decisions should always align with an individual’s risk tolerance and investment plan, often in consultation with a financial advisor.