Bitcoin Price Faces Critical Test: Bull Market ‘Confirmed Over’ After Fourth Consecutive Red Monthly Candle
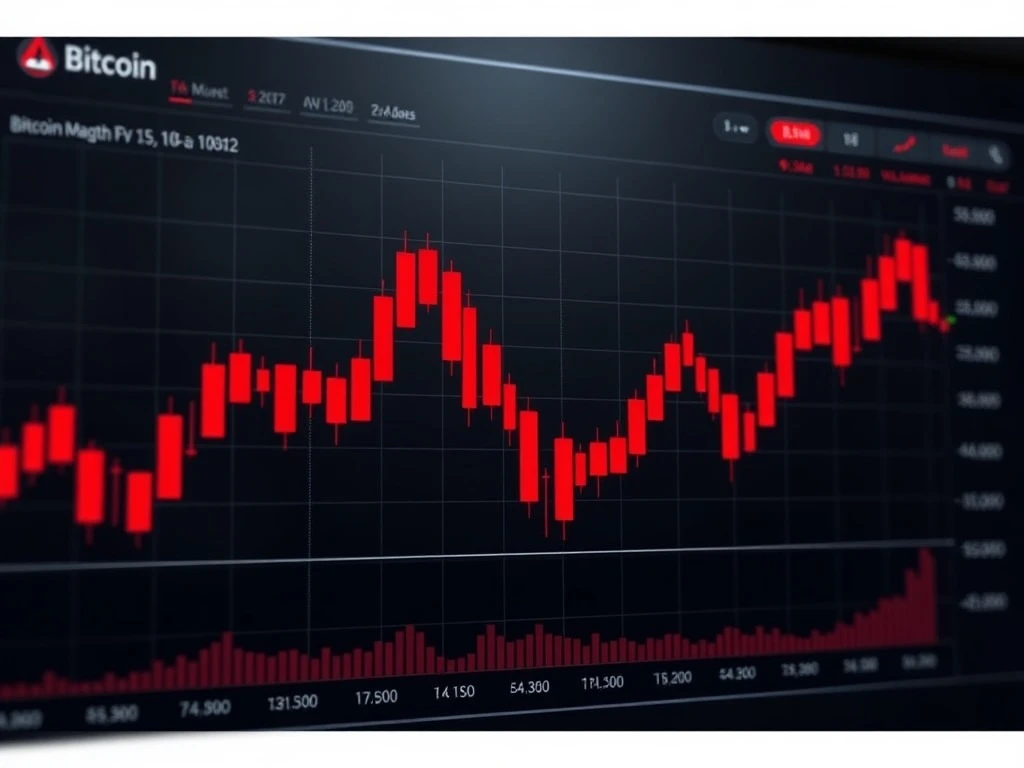
Global cryptocurrency markets entered a critical phase in January 2025 as Bitcoin recorded its fourth consecutive red monthly candle, sparking intense debate among analysts about whether the digital asset’s bull market has conclusively ended. The BTC price decline below $80,000 represents a significant technical development that historically precedes extended bearish periods, according to market data from multiple trading platforms.
Bitcoin Price Analysis Reveals Historical Pattern
Trading data from January 2025 confirms Bitcoin printed its fourth consecutive monthly decline, a phenomenon that has occurred only twice before in the cryptocurrency’s history. Market monitoring resource CoinGlass documented similar patterns during the 2014 and 2018 bear markets, providing crucial historical context for current price movements. The BTC/USD pair established new 16-month lows at $74,532 on the Bitstamp exchange before experiencing a modest 2% recovery during Monday’s Wall Street trading session.
Technical analysts immediately noted the significance of this development. Trading resource QCP Capital emphasized in its latest “Asia Color” market update that the coming sessions would likely determine market direction for the remainder of the quarter. The firm specifically highlighted the importance of the $74,000 support level, stating that a sustained close below this threshold would increase the risk of a deeper drawdown potentially returning the broader cryptocurrency complex to its 2024 trading range.
Expert Perspectives on Market Direction
Several prominent market commentators have shifted their positions regarding Bitcoin’s bull market continuation. Trader Jelle informed his substantial X following that the weekly chart showed a lower low on a closing basis, leading him to conclude the uptrend was “confirmed over.” He further suggested the market would likely require considerable time before establishing a meaningful turnaround.
Analyst Rekt Capital provided additional technical perspective, agreeing that Bitcoin appeared unlikely to challenge its October 2025 all-time high of $126,200. His analysis of weekly chart patterns led him to conclude that level likely represented the market top for the current cycle. These assessments collectively represent a significant shift in market sentiment among previously bullish commentators.
Comparative Analysis with Previous Market Cycles
Historical data reveals important context for understanding current market conditions. The four consecutive monthly declines represent only the third occurrence of this pattern in Bitcoin’s trading history. Previous instances in 2014 and 2018 both preceded extended bear markets that lasted multiple quarters. However, market analysts caution against direct historical comparisons, noting that Bitcoin’s market structure, institutional participation, and regulatory environment have evolved substantially since those periods.
Key historical comparisons:
- 2014 Bear Market: Followed Mt. Gox collapse, featured 83% peak-to-trough decline
- 2018 Bear Market: Followed ICO bubble, featured 84% peak-to-trough decline
- Current Market: Features stronger institutional infrastructure and regulatory clarity
Gold Market Correlation and Divergence
An intriguing market development emerged as Bitcoin and gold, which had moved in opposite directions for months, showed short-term correlation during the January decline. Gold (XAU/USD) experienced its own violent breakdown from all-time highs, attempting stabilization around $4,700 per ounce. QCP Capital analysts connected this reversal to the announcement of Kevin Warsh as the next Chair of the US Federal Reserve, noting this development weighed on demand for non-yielding precious metals.
The correlation between precious metals and cryptocurrency markets presents both challenges and opportunities according to market observers. Higher margin requirements imposed by futures exchanges accelerated the unwinding of leveraged positions in both asset classes, creating parallel pressure across traditionally divergent markets.
Potential Market Scenarios and Forward Projections
Despite prevailing bearish sentiment, some analysts identified potential catalysts for market recovery. Crypto trader and entrepreneur Michaël van de Poppe noted historical patterns where Bitcoin followed gold to new highs after a statutory delay. He suggested that while gold and silver might not achieve new all-time highs during 2026, this could potentially open “floodgates” toward cryptocurrency markets as capital seeks alternative stores of value.
Market participants currently monitor several key technical levels and fundamental developments:
- Critical Support: $74,000 level representing 16-month low
- Resistance Levels: $88,000 as potential breakout confirmation point
- Macro Factors: Federal Reserve policy, institutional adoption rates
- Technical Indicators: Monthly RSI, moving average convergence
Institutional Perspective and Market Structure
The current market environment differs substantially from previous bear cycles due to increased institutional participation. Major financial institutions now offer Bitcoin exposure through various products, including exchange-traded funds and structured products. This institutional infrastructure provides potential stability absent during previous declines, though it also introduces different market dynamics and correlation patterns with traditional financial markets.
Regulatory developments continue to influence market sentiment, with clearer frameworks emerging in major jurisdictions throughout 2024 and early 2025. These developments have reduced some uncertainty that previously contributed to market volatility, though geopolitical factors and macroeconomic conditions remain significant variables affecting cryptocurrency valuations.
Market Psychology and Trader Sentiment Analysis
The shift in market sentiment represents a crucial psychological component of the current market phase. After extended periods of bullish momentum, the consecutive monthly declines have tested trader conviction and risk tolerance. Social media sentiment analysis reveals increasing caution among retail traders, while institutional players appear focused on longer-term positioning rather than short-term price movements.
Options market data indicates changing risk perceptions, with put option volume increasing relative to call options throughout January. This shift in derivatives market positioning reflects growing hedging activity and risk management concerns among sophisticated market participants. The volatility term structure has also steepened, indicating expectations for near-term uncertainty.
Technological and Network Fundamentals
Despite price declines, Bitcoin’s network fundamentals remain robust. Hash rate continues near all-time highs, indicating strong miner commitment and network security. Transaction volume and active address metrics show resilience, suggesting continued utility and adoption regardless of price fluctuations. These fundamental strengths provide important context for evaluating whether current price movements represent temporary correction or fundamental repricing.
Layer-2 solutions and scaling developments continue progressing, with Lightning Network capacity maintaining steady growth throughout the price decline. These technological advancements support Bitcoin’s utility proposition independent of short-term price movements, potentially providing foundation for eventual market recovery.
Conclusion
Bitcoin faces a critical technical and psychological test as it records its fourth consecutive red monthly candle, a pattern historically associated with extended bear markets. The BTC price decline below key support levels has shifted market sentiment among many analysts, though historical patterns and fundamental strengths provide context for evaluating potential recovery scenarios. Market participants now monitor several key technical levels and macroeconomic developments that will likely determine Bitcoin’s price trajectory through 2025. The convergence of technical indicators, institutional participation, and regulatory developments creates a complex market environment requiring careful analysis of both historical patterns and evolving market structures.
FAQs
Q1: What does four consecutive red monthly candles mean for Bitcoin?
Four consecutive monthly declines represent a rare technical pattern that has occurred only twice before in Bitcoin’s history, both times preceding extended bear markets. However, current market conditions differ substantially from previous occurrences due to increased institutional participation and regulatory clarity.
Q2: Has Bitcoin’s bull market definitively ended?
While several prominent analysts suggest the bull market has concluded based on technical patterns, market cycles rarely provide definitive conclusions until significant time has passed. Historical comparisons suggest caution when declaring market phase transitions based solely on monthly candle patterns.
Q3: What key support levels are traders watching?
Market participants closely monitor the $74,000 level, which represents recent 16-month lows. A sustained break below this level could signal further declines, while holding above it might indicate potential stabilization and recovery.
Q4: How does current market structure differ from previous bear cycles?
The current environment features substantially greater institutional participation, clearer regulatory frameworks, more sophisticated derivatives markets, and stronger network fundamentals than during previous bear markets in 2014 and 2018.
Q5: What potential catalysts could reverse the current trend?
Potential catalysts include institutional adoption acceleration, favorable regulatory developments, macroeconomic shifts driving alternative asset demand, technological breakthroughs enhancing utility, or traditional market correlations breaking down during periods of financial stress.