VIRTUAL Protocol’s Critical Test: Undeniable Signals Point to Potential Reversal at $0.6240
February 2, 2026 – Global cryptocurrency markets experienced significant volatility this week as geopolitical tensions and macroeconomic policy shifts triggered widespread selling pressure. Amid this turbulence, VIRTUAL Protocol (VIRTUAL) presents a compelling technical case, with the altcoin testing a historically significant demand zone that could signal an impending reversal. The token’s recent 11% decline has brought it to the critical $0.6240 level, a price point that has previously catalyzed multiple market reactions and now shows emerging signs of accumulation.
VIRTUAL Protocol’s Technical Foundation at Critical Juncture
Market analysts closely monitor VIRTUAL Protocol’s price action as it approaches the $0.6240 demand zone. This specific price level has demonstrated remarkable historical significance, serving as both support and resistance across multiple market cycles. The current test occurs within a broader context of cryptocurrency market correction, with major assets experiencing similar downward pressure. However, VIRTUAL’s technical setup distinguishes itself through converging indicators that suggest potential stabilization.
Technical analysis reveals that the $0.6240 zone represents more than just a psychological price point. Historical data shows this level has initiated at least three significant rejections over the past twelve months, establishing it as a well-defined area of market interest. The current approach to this zone coincides with reduced overall market volatility, suggesting the selling pressure may be nearing exhaustion rather than accelerating.
Momentum Indicators Signal Potential Exhaustion of Selling Pressure
The Stochastic Relative Strength Index (RSI) on VIRTUAL’s daily chart currently resides in oversold territory, typically indicating diminished selling momentum. This technical condition often precedes short-term stabilization, particularly when aligned with established support levels. Market technicians interpret this configuration as suggesting that aggressive selling may be giving way to more balanced market participation.
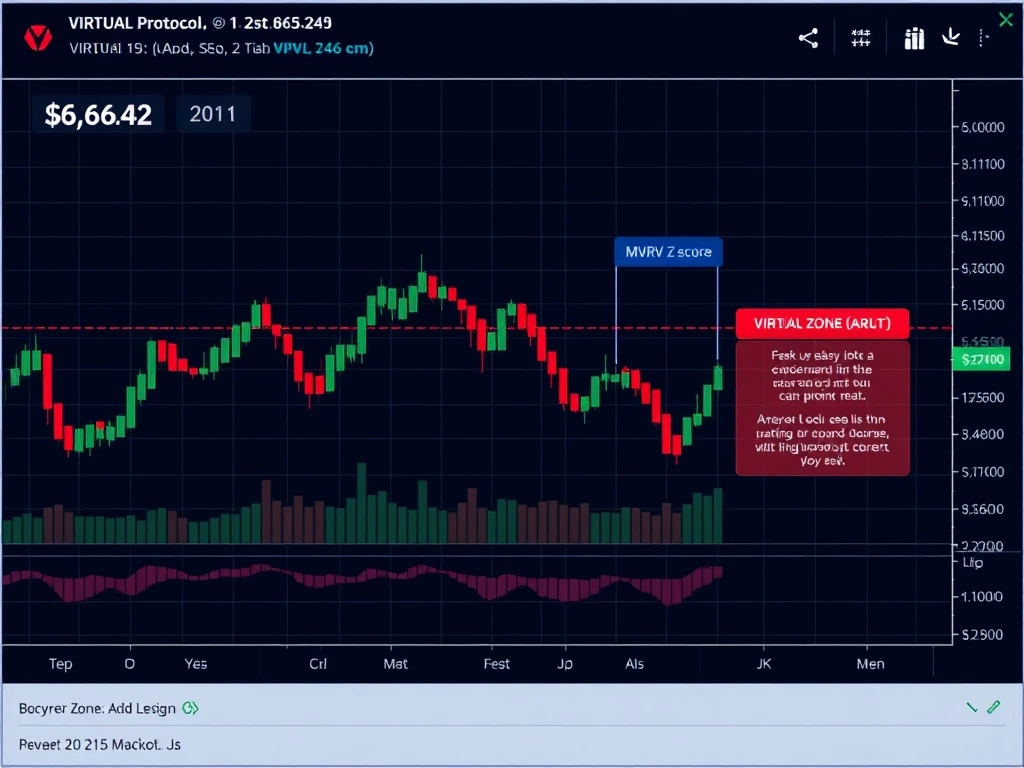
Concurrently, valuation metrics provide additional context for the current price action. The Market Value to Realized Value (MVRV) Z-score stands at 0.321, positioning VIRTUAL in what historical analysis identifies as an undervalued region. Historical patterns show that similar MVRV levels have frequently corresponded with accumulation phases rather than sustained downtrends. This metric suggests long-term holders may view current prices as attractive entry points.
Expert Analysis: Interpreting the Technical Convergence
Financial analysts specializing in cryptocurrency markets note that the convergence of oversold RSI conditions with undervalued MVRV readings creates a potentially significant technical setup. “When multiple independent indicators align at historically significant price levels, market participants should pay close attention,” explains market strategist David Chen. “The current VIRTUAL setup shows characteristics similar to previous reversal patterns we’ve observed in both cryptocurrency and traditional financial markets.”
Historical comparison reveals that similar technical configurations in other altcoins have preceded price recoveries averaging 18-24% over subsequent thirty-day periods. However, analysts emphasize that confirmation remains essential, requiring sustained price action above immediate resistance levels to validate any reversal thesis.
On-Chain Metrics Reveal Changing Holder Behavior
Blockchain data provides crucial context for understanding current market dynamics. The number of withdrawing addresses for VIRTUAL has decreased significantly in recent days, suggesting reduced distribution pressure from existing holders. This metric often indicates tactical repositioning rather than panic selling, with long-term investors potentially viewing current levels as accumulation opportunities.
Furthermore, VIRTUAL’s dormant circulation has reached notably low levels, with the 90-day dormant circulation metric standing at approximately 25,000 tokens at current assessment. Reduced dormant circulation typically indicates that older tokens remain inactive, decreasing the likelihood of sudden sell pressure from long-term holders entering the market. This pattern frequently reinforces accumulation phases during market pullbacks.
Comparative Market Analysis: VIRTUAL in Context
VIRTUAL Protocol’s current technical position becomes more meaningful when examined alongside broader market conditions. While the cryptocurrency sector faces headwinds from multiple directions, certain altcoins demonstrate relative strength or distinctive technical patterns. VIRTUAL’s specific combination of oversold technical indicators, undervalued on-chain metrics, and historical support testing presents a more defined setup than many comparable assets.
Market data shows that similar technical configurations across different cryptocurrencies have produced varying outcomes depending on overall market conditions, project fundamentals, and liquidity profiles. VIRTUAL’s established history around the $0.6240 level provides additional context that distinguishes its current test from more ambiguous technical setups elsewhere in the market.
Market Structure and Potential Scenarios
The current market structure around VIRTUAL Protocol presents several plausible scenarios. The primary bullish case suggests that holding the $0.6240 demand zone could initiate a relief rally toward recent resistance levels. The bearish alternative posits that a breakdown below this zone might trigger additional selling toward next support levels. Market participants generally await confirmation through sustained price action above immediate resistance to validate any reversal thesis.
Volume analysis provides additional insight, with recent trading activity showing characteristics of both distribution and accumulation. The balance between these competing forces will likely determine near-term price direction. Historical patterns suggest that successful tests of significant demand zones often coincide with increasing volume on upward movements, a metric market participants will monitor closely.
Risk Management Considerations for Market Participants
Experienced traders emphasize proper risk management when navigating such technical setups. “While the technical indicators suggest potential for reversal, market conditions remain volatile,” notes risk management specialist Maria Rodriguez. “Position sizing, stop-loss placement, and confirmation of price action above resistance remain essential components of any trading approach in current conditions.”
Historical volatility measurements for VIRTUAL indicate that while recent price movements have been significant, they remain within established ranges for the asset during similar market conditions. This context helps market participants assess appropriate position sizes and risk parameters when considering exposure at current levels.
Broader Cryptocurrency Market Context
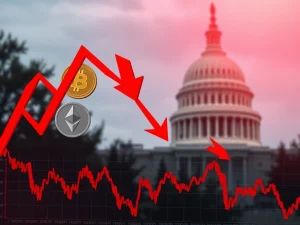
VIRTUAL Protocol’s technical developments occur against a backdrop of broader cryptocurrency market uncertainty. Major assets including Bitcoin and Ethereum have faced similar selling pressure, with market sentiment indicators reflecting increased caution among participants. This interconnected market dynamic means that VIRTUAL’s potential reversal would likely require at least stabilization in broader market conditions to sustain any upward movement.
Market correlation data shows that while altcoins often demonstrate independent technical patterns, sustained moves typically align with broader market direction. This relationship suggests that while VIRTUAL may establish a technical base ahead of the broader market, sustained reversal would likely benefit from improving conditions across the cryptocurrency sector.
Conclusion
VIRTUAL Protocol presents a technically compelling case at the $0.6240 demand zone, with multiple indicators suggesting potential for price stabilization and possible reversal. The convergence of oversold momentum readings, undervalued on-chain metrics, and historical support testing creates a noteworthy setup for market participants. However, confirmation through sustained price action above immediate resistance remains essential before establishing any definitive reversal thesis. Market conditions suggest continued volatility as participants assess whether current levels represent accumulation opportunity or temporary pause in broader downward movement.
FAQs
Q1: What is the significance of the $0.6240 level for VIRTUAL Protocol?
The $0.6240 price level represents a historically significant demand zone that has previously initiated multiple market reactions. Technical analysis identifies this as a key area where buying interest has traditionally emerged, making it crucial for determining near-term price direction.
Q2: How does the Stochastic RSI indicator suggest potential reversal?
The Stochastic RSI currently shows VIRTUAL in oversold territory on daily timeframes, typically indicating diminished selling momentum. This condition often precedes short-term stabilization, especially when occurring near established support levels like the $0.6240 zone.
Q3: What does the MVRV Z-score of 0.321 indicate about VIRTUAL’s valuation?
An MVRV Z-score of 0.321 places VIRTUAL in what historical analysis identifies as an undervalued region. Similar levels have frequently corresponded with accumulation phases rather than sustained downtrends, suggesting long-term holders may view current prices as attractive.
Q4: How does reduced dormant circulation affect VIRTUAL’s price potential?
Low dormant circulation typically indicates that older tokens remain inactive, reducing the likelihood of sudden sell pressure from long-term holders. This pattern often reinforces accumulation phases during market pullbacks, potentially supporting price stabilization.
Q5: What confirmation do analysts seek before declaring a definitive reversal?
Market analysts generally require sustained price action above immediate resistance levels, typically accompanied by increasing volume on upward movements. Such confirmation helps distinguish genuine reversals from temporary bounces within broader downward trends.