ASI Cryptocurrency Nears Critical Breakout That Could Spark the Next Market Rally as Buyers Seize Control
Global cryptocurrency markets are watching closely as ASI, the native token of the Alliance of SingularityNET, Fetch.ai, and Ocean Protocol, approaches a critical technical juncture that analysts believe could signal the beginning of the next significant market rally. According to multiple technical analysts monitoring the digital asset space, ASI has demonstrated remarkable resilience following recent market corrections, establishing strong support levels that now provide a foundation for substantial upward movement. The convergence of technical indicators suggests buyers are gaining decisive control over the market narrative, potentially positioning ASI for a breakout that could influence broader cryptocurrency sentiment.
ASI Cryptocurrency Technical Analysis Reveals Bullish Momentum
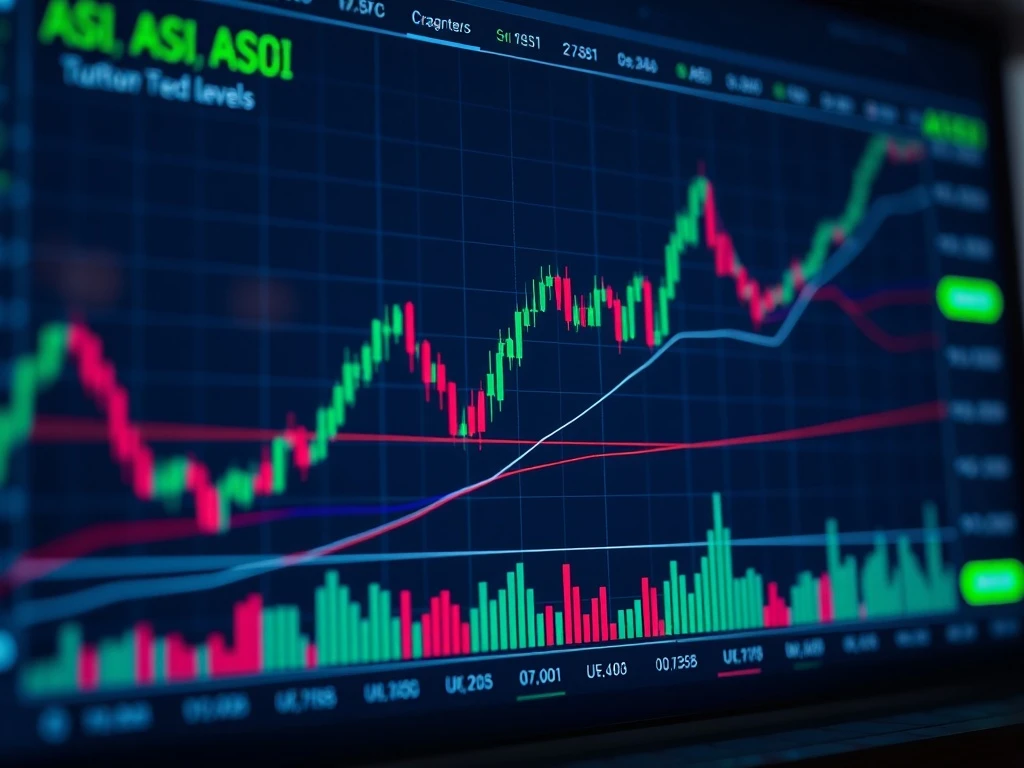
Technical analysts have identified several key factors contributing to ASI’s current market position. The cryptocurrency has successfully tested and held crucial support levels multiple times throughout recent trading sessions, demonstrating what market technicians describe as “accumulation behavior.” This pattern typically indicates institutional and sophisticated investors are establishing positions before anticipated upward moves. Furthermore, trading volume patterns show increasing buyer participation during price dips, a classic sign of underlying strength. The relative strength index (RSI) has reset from overbought conditions while maintaining above critical thresholds, suggesting healthy consolidation rather than distribution.
Market data reveals ASI has formed what technical analysts call a “compression pattern” over the past several weeks. This pattern occurs when volatility decreases while price action consolidates within increasingly narrow ranges, often preceding significant directional moves. The current compression has developed near previous resistance levels that have now transformed into support, creating what chart technicians refer to as a “spring-loaded” technical setup. Additionally, moving average convergence divergence (MACD) indicators show bullish crossovers on multiple timeframes, providing confirmation of shifting momentum.
Comparative Market Performance Analysis
When compared to broader cryptocurrency indices, ASI has demonstrated notable relative strength. While major market benchmarks experienced sharper declines during recent corrections, ASI maintained higher percentage retracements from its recent highs. This relative outperformance often signals underlying fundamental strength that technical traders monitor closely. The following table illustrates ASI’s performance relative to major cryptocurrency benchmarks over the past 30 trading days:
| Asset | 30-Day Performance | Support Level Holds | RSI Current Reading |
|---|---|---|---|
| ASI | -8.2% | 4 successful tests | 58.3 |
| Bitcoin (BTC) | -12.7% | 3 successful tests | 52.1 |
| Ethereum (ETH) | -14.3% | 2 successful tests | 49.8 |
| Crypto Total Market Cap | -11.9% | N/A | 51.5 |
Market Structure and Buyer Accumulation Patterns
Blockchain analytics firms report significant on-chain activity supporting the technical analysis observations. Exchange net flow data indicates decreasing ASI balances on trading platforms, suggesting investors are moving tokens to private wallets for longer-term holding. This reduction in immediately available supply typically creates upward price pressure when demand increases. Furthermore, the number of addresses holding ASI has grown consistently throughout the consolidation period, indicating distribution across a broadening investor base rather than concentration among few holders.
Several key metrics demonstrate buyer accumulation:
- Exchange Reserve Decline: Platform-held ASI decreased 18% over 30 days
- Address Growth: Active addresses increased 22% month-over-month
- Large Transaction Spike: Transactions over $100,000 rose 34% weekly
- Hodler Behavior: 76% of supply hasn’t moved in 30+ days
Market microstructure analysis reveals increasing bid density at current price levels. Order book data shows substantial buy orders accumulating just below current trading ranges, creating what market makers describe as a “bid wall” that provides technical support. This concentration of buying interest typically indicates institutional accumulation and often precedes breakout movements when combined with decreasing ask liquidity above current prices.
Historical Context and Previous Breakout Patterns
ASI’s current technical setup bears resemblance to previous successful breakout patterns observed in both cryptocurrency and traditional financial markets. Historical analysis of similar compression patterns preceding the merger announcement of SingularityNET, Fetch.ai, and Ocean Protocol shows that resolution typically occurs within 5-8 weeks of pattern formation. The current consolidation has persisted for approximately six weeks, placing it within the expected resolution timeframe according to historical precedent.
Previous breakout events in the ASI ecosystem have demonstrated specific characteristics that current technicals are beginning to mirror. These include:
- Volatility contraction to multi-week lows before expansion
- Increasing positive funding rates in perpetual swap markets
- Declining implied volatility in options markets despite spot consolidation
- Growing open interest in futures markets during sideways price action
Broader Market Implications and Potential Rally Catalysts
The potential ASI breakout carries significance beyond the individual asset, as technical analysts often view such movements as potential leading indicators for broader market sentiment. Cryptocurrency markets frequently exhibit correlation during trend initiations, where strength in fundamentally sound projects can spill over to related sectors. The artificial intelligence and decentralized AI sectors that ASI represents have shown increasing institutional interest throughout 2024, suggesting any breakout could attract additional capital to adjacent projects and technologies.
Several fundamental developments coincide with the improving technical picture. The ongoing integration of the three founding projects continues to reach developmental milestones, with recent updates indicating progress toward the unified technical vision. Furthermore, partnership announcements and ecosystem growth metrics have shown consistent improvement despite broader market volatility. These fundamental factors provide context for the technical strength observed in price action, creating what analysts describe as a “confluence” of supportive conditions.
Market participants should monitor several key levels and indicators for confirmation of the anticipated breakout. Technical analysts emphasize the importance of volume confirmation, noting that sustainable breakouts typically occur on volume exceeding 150% of the 20-day average. Additionally, successful resolution of compression patterns generally requires price to sustain above previous resistance levels for multiple consecutive closes, with follow-through buying confirming the new trend direction.
Risk Considerations and Market Dynamics
While technical indicators suggest bullish potential, market analysts emphasize the importance of risk management in current conditions. Cryptocurrency markets remain susceptible to broader macroeconomic influences, including interest rate expectations, regulatory developments, and traditional market correlations. Any breakout attempt that lacks sufficient volume or fails to hold above key resistance levels could result in what technicians call a “false breakout,” potentially leading to rapid reversals and increased volatility.
Seasoned market participants recommend monitoring several risk factors:
- Broader cryptocurrency market correlation during breakout attempts
- Macroeconomic data releases affecting risk asset sentiment
- Regulatory developments impacting the AI and blockchain sectors
- Liquidity conditions across cryptocurrency trading venues
- Derivatives market positioning and potential liquidation cascades
Conclusion
ASI cryptocurrency approaches a critical technical juncture with multiple indicators suggesting increasing buyer control and potential breakout conditions. The convergence of supportive technical patterns, on-chain accumulation signals, and fundamental developments creates an environment where sustained upward movement appears increasingly probable according to technical analysis methodologies. While market participants should remain cognizant of broader risk factors and required confirmations, the current setup presents what analysts describe as a textbook preparation phase for potential trend initiation. The resolution of this technical compression will likely provide meaningful signals about both ASI’s intermediate-term direction and broader sentiment within the artificial intelligence cryptocurrency sector.
FAQs
Q1: What technical indicators suggest ASI is nearing a breakout?
Multiple technical indicators point toward potential breakout conditions, including compression pattern formation, successful support tests, bullish MACD crossovers on several timeframes, RSI maintaining above key levels during consolidation, and increasing buying volume during price dips.
Q2: How does ASI’s current performance compare to broader cryptocurrency markets?
ASI has demonstrated relative strength compared to major benchmarks, with smaller drawdowns during recent corrections and more successful tests of support levels. This outperformance often signals underlying fundamental strength that technical analysts monitor closely.
Q3: What on-chain metrics support the technical analysis observations?
On-chain data shows decreasing exchange reserves, growing active addresses, increasing large transactions, and high percentages of unmoved supply—all indicators of accumulation behavior that typically precedes upward price movements.
Q4: What confirmation signals should traders watch for regarding the potential breakout?
Traders should monitor volume expansion exceeding 150% of averages, sustained price action above key resistance levels for multiple closes, continued on-chain accumulation patterns, and follow-through buying after initial breakout attempts.
Q5: What broader market implications could an ASI breakout have?
Successful breakouts in fundamentally sound projects like ASI often influence sentiment toward related sectors, potentially attracting capital to artificial intelligence and decentralized technology cryptocurrencies while serving as a leading indicator for broader market trends.