Solana Price Analysis: On-Chain Activity Surges While SOL Faces Critical Breakdown Risk

February 1, 2026 – Global cryptocurrency markets face renewed pressure as Solana (SOL) demonstrates a concerning divergence between rising network activity and declining price action. Despite increased blockchain utilization, technical indicators suggest SOL may test critical support levels in coming weeks. Market analysts observe this unusual dynamic where fundamental network strength contrasts with bearish price structure.
Solana Technical Analysis Reveals Bearish Structure
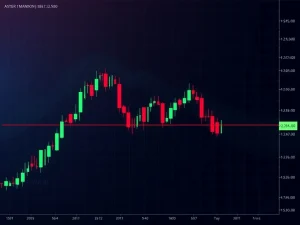
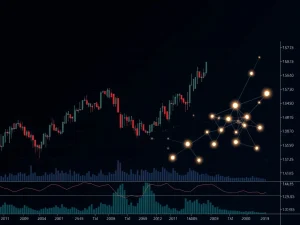
Technical examination of Solana’s weekly chart confirms a significant trend shift. The cryptocurrency failed to breach the crucial $150 supply zone despite multiple attempts since November 2025. This failure triggered a bearish structure break that began in April 2025. The September 2025 rejection at the 78.6% Fibonacci retracement level at $252.9 validated this trend reversal.
Market data shows SOL currently testing the $100 support zone after descending from higher resistance levels. The Relative Strength Index (RSI) on daily timeframes entered oversold territory with readings near 22. This technical condition typically indicates excessive selling pressure. However, oversold readings alone don’t guarantee immediate reversal.
Key Technical Levels and Market Structure
Analysis identifies several critical price levels that traders monitor closely. The $120 and $140 zones represent immediate supply areas where selling pressure historically intensifies. Below current levels, $95 serves as the next major support, followed by $78 and $64. These levels correspond with previous swing lows and consolidation areas.
The On-Balance Volume (OBV) indicator reached multi-month lows, reflecting sustained selling volume. This metric measures buying and selling pressure by adding volume on up days and subtracting volume on down days. The declining OBV suggests distribution rather than accumulation.
On-Chain Activity Presents Bullish Counterpoint
Despite bearish price action, Solana’s network fundamentals show strength. Increased on-chain activity indicates growing blockchain utilization across various applications. This divergence creates an interesting market dynamic where network usage expands while token valuation contracts.
Blockchain analysts note that sustained network activity typically precedes price appreciation in cryptocurrency markets. However, the current market environment presents exceptions to this pattern. The conversion of speculative interest into tangible economic value through actual usage represents a positive long-term development for Solana’s ecosystem.
Institutional Perspectives and Long-Term Projections
Several financial institutions maintain optimistic long-term outlooks despite current bearish conditions. VanEck’s research models present a bullish scenario projecting SOL reaching $3,200 by 2029. This analysis considers network adoption, technological development, and market expansion factors.
Other prediction platforms like Kalshi express more conservative near-term expectations. These services generally dismiss ambitious short-term targets like $450 while acknowledging the feasibility of $1,000+ valuations over extended time horizons. The disparity between short-term technical signals and long-term fundamental projections creates complex decision-making environments for investors.
Market Context and Bitcoin Correlation
Solana’s price action remains closely correlated with broader cryptocurrency markets, particularly Bitcoin. Analysis indicates that Bitcoin maintaining support above $74,000 provides crucial stability for altcoins. A breakdown below this level would likely accelerate selling pressure across cryptocurrency markets.
The current market environment reflects broader macroeconomic concerns and regulatory developments. Recent government actions, including India’s Budget 2026 with new cryptocurrency reporting penalties, contribute to market uncertainty. These regulatory developments influence investor sentiment and capital allocation decisions.
Trading Strategy Considerations
Professional traders approach current market conditions with specific strategies. Swing traders typically wait for price bounces toward resistance zones before considering short positions. The $120 level represents a potential area for such tactical entries if reached through corrective price action.
Risk management remains paramount in volatile market conditions. Position sizing, stop-loss placement, and portfolio diversification help mitigate downside risk. Experienced traders emphasize that technical analysis provides probability assessments rather than certain predictions.
Comparative Market Analysis
Solana’s performance contrasts with other major cryptocurrencies experiencing similar pressures. Chainlink recently declined below $11 following a 22% sell-off, while Zcash tests critical support after a 13% weekly drop. These parallel movements suggest sector-wide dynamics rather than Solana-specific issues.
The cryptocurrency market’s interconnected nature means developments affecting one major asset often influence others. Regulatory announcements, macroeconomic data, and institutional investment flows create ripple effects across digital asset markets.
Historical Context and Market Cycles
Current market conditions reflect patterns observed in previous cryptocurrency cycles. The 2017 market cycle demonstrated similar periods where network fundamentals diverged from price action temporarily. Historical analysis suggests these divergences often resolve through significant price movements in either direction.
Seasoned market participants with experience across multiple cycles emphasize patience and perspective. They note that cryptocurrency markets typically experience heightened volatility during transition periods between market phases. The current environment may represent such a transitional phase.
Conclusion
Solana presents a complex market picture with rising on-chain activity contrasting with bearish price structure. Technical analysis indicates potential further decline toward the $95 support level, while network fundamentals suggest underlying strength. This Solana price analysis reveals critical levels traders monitor, including the $120 resistance zone and $95 support area. Market participants must consider both technical signals and fundamental developments when making investment decisions. The coming weeks will determine whether network activity eventually translates into price appreciation or if bearish technical patterns prevail.
FAQs
Q1: What is causing Solana’s price decline despite increased on-chain activity?
The divergence between price and network activity reflects complex market dynamics including broader cryptocurrency trends, technical breakdowns, and investor sentiment shifts. While network usage grows, selling pressure from various market participants drives price downward.
Q2: What are the key support levels for SOL according to technical analysis?
Technical analysis identifies $95 as the immediate critical support, followed by $78 and $64. These levels correspond with previous swing lows and consolidation areas where buying interest may emerge.
Q3: How does Bitcoin’s price action affect Solana?
Solana maintains significant correlation with Bitcoin. If Bitcoin breaks below $74,000 support, it would likely increase selling pressure across cryptocurrency markets, including Solana. Bitcoin’s stability provides important context for altcoin performance.
Q4: What trading strategies are appropriate in current market conditions?
Swing traders may consider short positions on bounces toward resistance zones like $120, targeting lower support levels. Long-term investors might view current levels as accumulation opportunities, though proper risk management remains essential in volatile conditions.
Q5: How reliable are long-term price predictions for Solana?
Long-term projections from institutions like VanEck consider fundamental factors but represent scenarios rather than guarantees. Market conditions, technological developments, regulatory changes, and adoption rates will ultimately determine Solana’s future valuation.