Bitcoin Slump: Devastating $2.58B Crypto Liquidations Crush BTC and ETH Prices
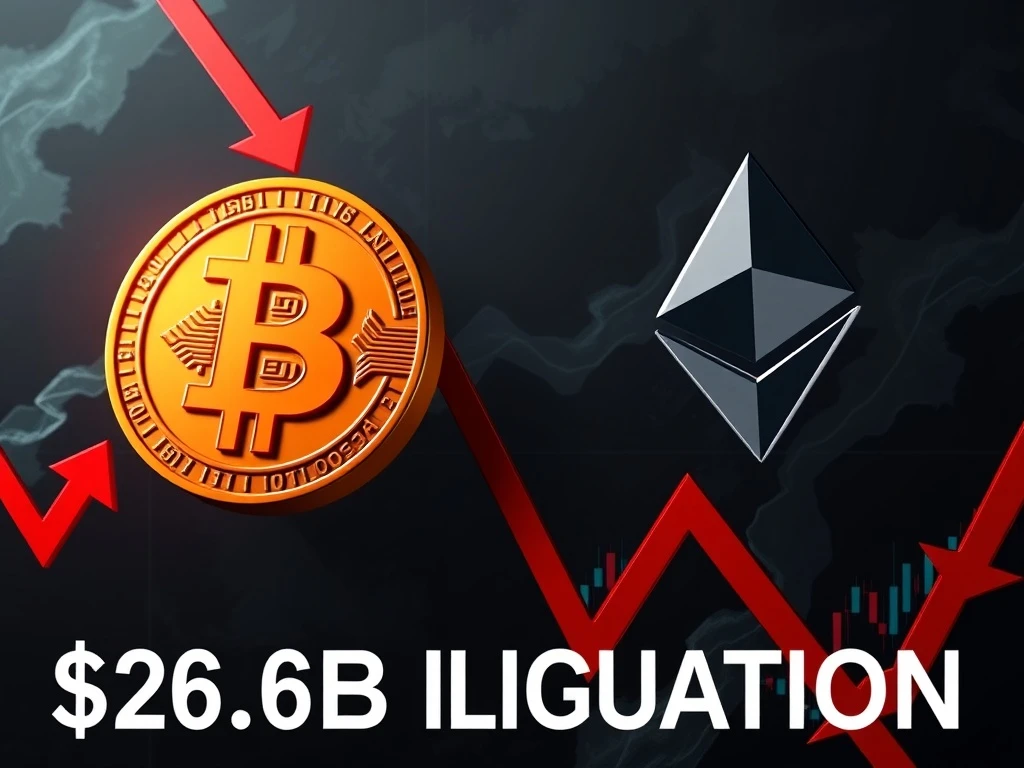
Global cryptocurrency markets experienced a severe downturn on Tuesday, with Bitcoin plunging below $80,000 and Ethereum dropping under $2,500 following massive $2.58 billion in liquidations that triggered widespread investor panic and heightened market volatility across digital asset exchanges.
Bitcoin Slump: Analyzing the $80,000 Breakdown
Bitcoin’s price decline represents a significant technical breakdown. The cryptocurrency had maintained support above $80,000 for several weeks. Market analysts immediately identified multiple contributing factors. First, excessive leverage in derivatives markets created a cascade effect. Second, institutional profit-taking accelerated the downward momentum. Third, macroeconomic concerns about interest rates resurfaced. The liquidation events primarily affected long positions. Consequently, forced selling amplified the initial price decline. This created a feedback loop of additional liquidations.
Historical data reveals similar patterns during previous market corrections. For instance, the May 2021 liquidation event saw $2.5 billion in positions closed. Similarly, the November 2022 FTX collapse triggered comparable market mechanics. However, current market conditions differ substantially. Today’s cryptocurrency ecosystem features more institutional participation. Additionally, regulatory frameworks have evolved significantly. These factors influence both the severity and recovery potential of such events.
Technical Analysis Perspective
Technical indicators showed clear warning signals before the crash. The Relative Strength Index (RSI) entered overbought territory repeatedly. Meanwhile, trading volume patterns indicated weakening momentum. Several key support levels failed consecutively. The $82,000 level broke first during Asian trading hours. Subsequently, the $80,000 psychological barrier collapsed under selling pressure. Market structure analysis suggests consolidation may follow. However, volatility typically increases during such periods.
Ethereum Drop: Understanding the $2,500 Support Failure
Ethereum’s decline below $2,500 represents a critical technical development. The second-largest cryptocurrency faced similar liquidation pressures. Ethereum’s derivatives market has grown substantially. Therefore, liquidation events now impact ETH prices more significantly. Several specific factors contributed to Ethereum’s underperformance. First, network upgrade concerns created additional uncertainty. Second, DeFi protocol outflows accelerated the selling pressure. Third, staking dynamics influenced market liquidity conditions.
The Ethereum ecosystem faces unique challenges during market downturns. Gas fee volatility typically increases during such periods. Additionally, decentralized application usage patterns change dramatically. NFT marketplace volumes often decline substantially. Meanwhile, DeFi protocol TVL (Total Value Locked) metrics show significant reductions. These ecosystem effects create secondary impacts on ETH’s fundamental valuation.
Comparative Market Analysis
| Metric | Bitcoin (BTC) | Ethereum (ETH) |
|---|---|---|
| Price Decline | 12.4% | 14.7% |
| Liquidations Impact | $1.42B | $0.86B |
| Support Level Broken | $80,000 | $2,500 |
| 24h Trading Volume | $42.8B | $18.3B |
$2.58B Crypto Liquidations: Market Mechanics Explained
The $2.58 billion liquidation event represents one of 2025’s most significant market adjustments. Liquidation mechanics follow specific patterns across exchanges. When prices decline rapidly, leveraged positions face margin calls. Subsequently, exchanges automatically close these positions. This creates additional selling pressure. The process typically unfolds in distinct phases:
- Initial Trigger: Price movement breaches key technical levels
- Cascade Effect: Liquidations create forced selling
- Amplification: Additional positions face margin calls
- Stabilization: Market finds new equilibrium levels
Exchange data reveals specific patterns in the liquidation distribution. Binance experienced the largest liquidation volume at $892 million. OKX followed with $643 million in closed positions. Meanwhile, Bybit recorded $487 million in liquidations. These figures demonstrate the global nature of the event. Geographic analysis shows Asian markets experienced the initial selling pressure. European and American traders subsequently amplified the movement.
Liquidation Timeline Analysis
The liquidation event unfolded over approximately eight hours. Asian trading sessions initiated the downward movement. European markets then accelerated the decline. Finally, American traders responded to the developing situation. This chronological pattern reflects modern cryptocurrency market dynamics. Global 24/7 trading creates continuous price discovery. However, regional trading patterns still influence market behavior significantly.
Heightened Volatility and Investor Caution Responses
Market volatility indices reached annual highs during the event. The Bitcoin Volatility Index (BVOL) surged 48% within 24 hours. Similarly, implied volatility metrics for options contracts spiked dramatically. These indicators reflect increased uncertainty among market participants. Institutional investors responded with specific risk management strategies. Many reduced exposure through hedging instruments. Others increased cash positions substantially. Retail investor behavior showed different patterns. Social media sentiment analysis reveals panic selling among inexperienced traders.
Market infrastructure demonstrated resilience during the volatility spike. Major exchanges maintained normal operations throughout. Order book depth recovered relatively quickly. However, some decentralized exchanges experienced temporary congestion. Gas fees on Ethereum network peaked at 150 gwei. These technical challenges highlight ongoing infrastructure development needs.
Regulatory Environment Considerations
Current regulatory developments influence market responses significantly. The SEC’s updated guidance on cryptocurrency derivatives affects market structure. Additionally, international coordination on stablecoin regulation creates new dynamics. Market participants must navigate this evolving landscape carefully. Regulatory clarity typically reduces long-term volatility. However, transitional periods often increase short-term uncertainty.
Historical Context and Market Cycle Analysis
Historical analysis provides valuable perspective on current events. Previous liquidation events followed similar patterns but different magnitudes. The cryptocurrency market has matured substantially since earlier cycles. Institutional participation now exceeds 40% of total volume. This changes market dynamics fundamentally. Additionally, derivative market sophistication has increased dramatically. Options and futures products provide more hedging opportunities. Consequently, recovery patterns may differ from historical precedents.
Market cycle theory suggests specific phases follow such events. Typically, a consolidation period precedes the next directional movement. However, fundamental factors ultimately determine long-term trends. Bitcoin’s adoption metrics continue showing positive developments. Similarly, Ethereum’s ecosystem growth remains robust. These fundamentals provide context for evaluating short-term price movements.
Conclusion
The Bitcoin slump and Ethereum drop below key psychological levels represent a significant market adjustment triggered by $2.58 billion in crypto liquidations. This event highlights the interconnected nature of modern cryptocurrency markets, where derivatives trading significantly impacts spot prices. While heightened volatility and investor caution dominate current market sentiment, historical patterns suggest such corrections often create long-term buying opportunities. Market participants should monitor technical developments closely while maintaining perspective on fundamental cryptocurrency adoption trends. The cryptocurrency market’s evolution continues demonstrating both increased sophistication and persistent volatility characteristics.
FAQs
Q1: What caused the massive crypto liquidations?
The liquidations resulted from a combination of excessive leverage in derivatives markets, technical breakdowns below key support levels, and cascading margin calls that created forced selling across multiple exchanges.
Q2: How does this Bitcoin slump compare to previous crashes?
While similar in mechanics to previous liquidation events, the current Bitcoin slump occurs in a more mature market with greater institutional participation and more sophisticated financial instruments, potentially affecting recovery patterns.
Q3: What are liquidations in cryptocurrency trading?
Liquidations occur when exchanges automatically close leveraged positions that can no longer meet margin requirements due to adverse price movements, creating forced selling that amplifies market moves.
Q4: Could this trigger a longer-term bear market?
While possible, current fundamental adoption metrics and institutional participation suggest this may represent a correction within a larger trend rather than the beginning of a prolonged bear market.
Q5: How should investors respond to such volatility?
Investors should review risk management strategies, avoid panic selling, consider dollar-cost averaging during volatility, and maintain perspective on long-term cryptocurrency adoption fundamentals.