Chainlink Price Analysis: Can LINK Bulls Mount a Crucial Defense After 22% Plunge?
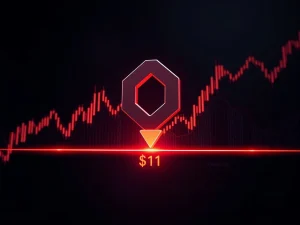
February 1, 2026 – The cryptocurrency market witnessed a significant tremor as Chainlink (LINK), a cornerstone of blockchain oracle infrastructure, plunged below the critical $11 mark. This 22% sell-off in late January shattered a multi-month support zone, forcing traders and analysts to scrutinize on-chain metrics and market structure for signs of a potential reversal or further decline. The move coincided with broader market weakness, amplifying pressure on altcoins and testing the resilience of long-term bullish narratives.
Chainlink Price Breakdown: Anatomy of a 22% Sell-Off
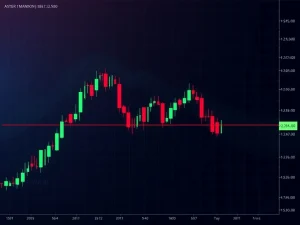
The recent price action for LINK proved decisive and damaging. For approximately ten weeks, from mid-November 2025, the cryptocurrency found consistent support within the $10.6 to $11.75 range. This zone also aligned with key Fibonacci retracement levels from its previous rally, giving it technical significance. However, sustained selling pressure in the final week of January 2026 overwhelmed buyers, resulting in a clean breakdown. Consequently, LINK’s price settled near $10.50, erasing a substantial portion of its Q4 2025 gains.
This decline manifested alongside a sharp drop in momentum. Chainlink’s Relative Strength Index (RSI) on daily timeframes fell to its lowest level since the bear market lows of 2022. Such an extreme reading often signals oversold conditions but does not guarantee an immediate reversal. Furthermore, the sell-off unfolded within a challenging macro environment for digital assets. Bitcoin, the market bellwether, concurrently retreated below the $85,000 level, triggering a risk-off sentiment that cascaded through the altcoin sector.
On-Chain Data Reveals a Clash Between Price and Sentiment
Despite the stark price weakness, deeper blockchain data presents a more nuanced picture. According to analytics firm CryptoQuant, a key metric known as Taker Buy Dominance remained elevated throughout the decline. This metric measures the volume of market orders that are buys versus sells, indicating aggressive buying pressure even as prices fell. Historically, persistent buying during a downturn can signal accumulation by larger players who view the asset as undervalued.
Another critical dataset from Glassnode adds context to the current holder pain. The total supply of LINK held at a loss surged toward 400 million tokens during the sell-off. This spike indicates a large portion of the network’s participants are now underwater on their investments. Analysts often watch this metric for extremes, as previous market cycles have shown that peaks in supply-in-loss can precede major bottoms, marking periods of maximum capitulation before a trend change.
Liquidity and Market Structure: The Path Forward
The immediate technical landscape now centers on liquidity. Data from derivatives tracking platforms like CoinGlass highlighted dense clusters of liquidation orders between $12 and $13 during the sell-off. Price interacted heavily with this zone before breaking down. For a recovery to gain traction, bulls must first reclaim the $11 level, which could trigger a wave of short-covering and attract liquidity-seeking algorithmic trades. Failure to hold above $10.50, however, may open the door for a test of lower supports near $9.50.
The following table summarizes the key technical and on-chain levels for Chainlink:
| Level | Type | Significance |
|---|---|---|
| $13.00 – $13.50 | Resistance | Previous support, now resistance; high liquidation zone. |
| $11.00 – $11.75 | Critical Resistance | Breached support zone; key level for bull reclamation. |
| $10.50 – $10.60 | Immediate Support | Current trading zone; last defense before deeper drop. |
| ~$9.50 | Next Major Support | Historical swing low from Q3 2025. |
Broader Context: Chainlink’s Fundamental Bedrock
Beyond the charts, Chainlink’s core value proposition remains intact. The network continues to serve as critical infrastructure, securing tens of billions in value across decentralized finance (DeFi), non-fungible tokens (NFTs), and traditional finance (TradFi) integrations. Key developments in 2025, including the expansion of its Cross-Chain Interoperability Protocol (CCIP) and new data feeds, underscore its utility. This fundamental strength often provides a long-term anchor for price, suggesting that severe downturns may be viewed as buying opportunities by institutions focused on ecosystem growth rather than short-term volatility.
Market analysts point to several factors that could catalyze a recovery:
- Bitcoin Stabilization: A recovery in BTC above $85,000 would likely improve sentiment across altcoins.
- On-Chain Capitulation Signals: The extreme supply-in-loss metric has historically marked sentiment lows.
- Derivatives Reset: The sell-off liquidated excessive leverage, creating a healthier foundation.
- Network Growth: Continued adoption of Chainlink services can drive long-term demand for LINK.
Conclusion
The Chainlink price breakdown below $11 represents a significant technical failure that has placed LINK bulls on the defensive. While the sell-off was severe and coincided with broad market weakness, underlying on-chain data reveals a conflict between price action and holder behavior. Persistent taker buy volume and a spike in supply-in-loss suggest elements of capitulation and accumulation are occurring simultaneously. The immediate focus rests on whether buyers can defend the $10.50 zone and stage a reclaim of the $11 support level. Success there could pave the way for a relief rally, while failure may extend the correction. Ultimately, Chainlink’s robust fundamental role in the blockchain ecosystem provides a compelling backdrop for this high-stakes market structure battle.
FAQs
Q1: Why did Chainlink (LINK) price drop so sharply?
The 22% drop resulted from a combination of technical breakdown below key support near $11, a broader crypto market downturn led by Bitcoin, and likely the flushing out of overleveraged derivative positions.
Q2: What is the “supply in loss” metric, and why is it important?
This metric, provided by Glassnode, shows the total number of LINK tokens currently held at a price lower than when they were acquired. A sharp spike, like the recent move toward 400 million LINK, often indicates widespread holder pain and has historically preceded market bottoms.
Q3: What price level is most critical for LINK bulls to reclaim?
The $11 to $11.75 zone is now the most critical resistance level. Reclaiming this former support area would signal that the breakdown was a false move and could trigger short-covering, potentially leading to a retest of $13.
Q4: Does the high “Taker Buy Dominance” mean the price will rebound immediately?
Not necessarily. While it shows aggressive buying interest during the decline, which is a positive divergence, it does not guarantee an immediate reversal. It does, however, suggest that some market participants see value at lower prices, which can establish a foundation for recovery.
Q5: How does Bitcoin’s price affect Chainlink?
As a major altcoin, Chainlink generally correlates with Bitcoin’s market movements. Bitcoin’s drop below $85,000 created a risk-off environment that pressured all altcoins, including LINK. A stabilization or recovery in Bitcoin is typically a prerequisite for a sustained altcoin rally.