Zcash Price at Critical Crossroads: 13% Weekly Plunge Signals Make-or-Break Moment for ZEC
Zcash (ZEC) confronts a decisive technical moment as the privacy-focused cryptocurrency experiences a 13% weekly decline, pushing its price toward a critical support zone that could determine its near-term trajectory. The digital asset, trading at $322 as of February 1, 2026, marks its fourth consecutive day of losses amid broader market uncertainty and declining trading volume. This price action places ZEC at what analysts describe as a “make-or-break” level, with technical indicators suggesting potential for either significant reversal or further substantial decline.
Zcash Technical Analysis Reveals Critical Support Zone
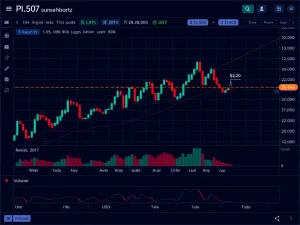
ZEC’s current price action demonstrates concerning patterns across multiple timeframes. On the weekly chart, the asset forms its fifth consecutive red candle, indicating sustained selling pressure. Meanwhile, the daily chart reveals a bearish structure of lower highs and lower lows, with the price currently testing the crucial $310 support level. Historically, this level has served as a significant reversal point; the last time ZEC reached $310, it recorded a strong 70% recovery. However, current market conditions differ substantially from previous instances.
Trading volume has declined by 12% to $450 million, reflecting growing hesitation among market participants. This reduction in market participation often precedes significant price movements, as traders await clearer directional signals. The combination of technical patterns and volume dynamics creates what technical analysts call a “compression zone,” where price typically breaks decisively in one direction.
Key Technical Indicators and Their Implications
Several technical metrics provide insight into ZEC’s current condition. The Average Directional Index (ADX), which measures trend strength, stands at 22.32. This reading falls below the key threshold of 25, indicating that ZEC currently lacks strong directional momentum. Such conditions often precede significant breakouts or breakdowns as markets build energy for the next major move.
The Money Flow Index (MFI), which tracks buying and selling pressure by combining price and volume data, hovers around 43. This neutral reading suggests neither buyers nor sellers currently dominate the market. However, neutral conditions at critical support levels frequently resolve with decisive moves as market participants commit to positions.
| Indicator | Current Value | Interpretation |
|---|---|---|
| Current Price | $322 | Testing critical support |
| Weekly Change | -13% | Sustained selling pressure |
| 24-Hour Volume | $450M (-12%) | Declining participation |
| ADX (Trend Strength) | 22.32 | Weak directional momentum |
| MFI (Money Flow) | 43 | Neutral market conditions |
| Critical Support | $310 | Make-or-break level |
Derivatives Market Positioning and Liquidation Risks
Derivatives data reveals how traders are positioning themselves amid this uncertainty. According to CoinGlass analytics, intraday traders have built significant leveraged positions around current price levels. Specifically, traders have established approximately $4.04 million in long-leveraged positions and $8.99 million in short-leveraged positions. This 2:1 ratio favoring short positions indicates that derivatives traders align with ZEC’s broader bearish trend.
The concentration of long positions at $317.8 creates a critical liquidation zone. If ZEC’s price falls below this level, approximately $4.04 million in long positions could face forced liquidation. Such liquidations typically accelerate downward momentum as positions unwind, potentially triggering cascading effects through the market. Conversely, short positions concentrated at $328.9 represent resistance that could cap any recovery attempts.
Expert Analysis and Price Projections
Market analysts offer varying perspectives on ZEC’s potential paths forward. A well-followed cryptocurrency expert recently noted on social media platform X that failure to bounce from the $290–$300 range could push ZEC toward the next support zone at $270. More bearish scenarios suggest a drop toward $200 cannot be ruled out if broader market conditions deteriorate further.
Technical analysis based on historical patterns suggests that if ZEC fails to hold the $310 support level, the next major support could be approximately 35% lower, around $200. This projection aligns with Fibonacci retracement levels from previous market cycles and represents a psychologically significant round number that often attracts buying interest.
Broader Market Context and Influencing Factors
ZEC’s current situation unfolds against a complex macroeconomic and cryptocurrency market backdrop. Several factors contribute to the current uncertainty:
- Geopolitical tensions affecting global risk assets
- Regulatory developments in major cryptocurrency markets
- Broader cryptocurrency market sentiment showing increased risk aversion
- Institutional flows showing recent outflows from cryptocurrency ETFs
- Technical developments within the Zcash ecosystem itself
The cryptocurrency ETF market recently experienced its largest outflows since November 2025, with approximately $1.7 billion exiting these products. Such institutional movements often influence retail sentiment and altcoin performance, as capital rotates toward or away from the broader digital asset space.
Historical Precedents and Market Psychology
Zcash has faced similar technical situations throughout its history. The asset’s previous encounter with the $310 level resulted in a dramatic 70% reversal, creating what technical analysts call a “historical memory level.” Such levels often attract attention from both retail and institutional traders who remember previous price action at these points.
Market psychology plays a crucial role at these junctures. The current decline in trading volume suggests traders are waiting for clearer signals before committing capital. This hesitation can create vacuum conditions where relatively small order flows produce disproportionate price movements once direction becomes clear.
Potential Scenarios and Risk Management Considerations
Traders and investors face several possible outcomes for ZEC in the coming days and weeks. Each scenario carries distinct implications and requires different risk management approaches:
Bullish Scenario: ZEC holds above $310 and begins to form higher lows. This would require increased buying volume and potentially positive catalyst from either broader market recovery or Zcash-specific developments. A successful hold at this level could target resistance zones at $350 and $380.
Bearish Scenario: ZEC breaks below $310 with conviction, triggering long liquidations and accelerating selling pressure. This could push the price toward the $270 support zone initially, with potential for further decline to $200 if market conditions worsen. Such a move would represent approximately 35% downside from current levels.
Sideways Consolidation: ZEC remains range-bound between $310 and $330 as market participants await clearer directional signals. This scenario would likely see continued low volume and choppy price action until a catalyst emerges.
Strategic Implications for Different Market Participants
Different types of market participants approach such technical situations with varying strategies. Long-term investors might view potential declines as accumulation opportunities if they believe in Zcash’s fundamental value proposition. Meanwhile, short-term traders typically focus on the directional break and subsequent momentum.
Institutional participants often monitor such technical levels for potential entry or exit points, particularly when combined with derivatives positioning data. The current concentration of leveraged positions creates what risk managers call “liquidation clusters,” areas where price movement could trigger disproportionate effects.
Conclusion
Zcash stands at a critical technical juncture as the cryptocurrency tests the crucial $310 support level following a 13% weekly decline. The combination of bearish price patterns, declining trading volume, and derivatives positioning suggests heightened risk of further downside if this support fails. However, the same factors that create risk also create opportunity, as decisive breaks from compression zones often lead to significant directional moves. Market participants should monitor volume patterns, derivatives liquidations, and broader market sentiment as ZEC approaches this make-or-break moment. The coming days will likely determine whether Zcash can mount a historical reversal similar to previous encounters with this level or whether it will break down toward significantly lower support zones.
FAQs
Q1: What is the current critical support level for Zcash?
The critical support level for Zcash is $310. This price point represents a make-or-break technical level where previous reversals have occurred. A break below this level could trigger significant further declines.
Q2: How much has ZEC dropped in the past week?
Zcash has declined approximately 13% over the past week, marking its fourth consecutive day of losses. This sustained selling pressure has pushed the cryptocurrency toward critical technical support levels.
Q3: What technical indicators are traders watching for ZEC?
Traders are monitoring several key indicators including the $310 support level, trading volume trends, the Average Directional Index (currently 22.32), and the Money Flow Index (around 43). Derivatives positioning and liquidation levels also provide important signals.
Q4: What is the potential downside risk if ZEC breaks support?
Technical analysis suggests that if ZEC breaks below the $310 support level, the next major support could be approximately 35% lower around $200. This projection is based on historical patterns and Fibonacci retracement levels.
Q5: How are derivatives traders positioned regarding ZEC?
Derivatives data shows traders have built approximately $4.04 million in long-leveraged positions and $8.99 million in short-leveraged positions. This 2:1 ratio favoring short positions suggests derivatives traders align with the broader bearish trend.