Monero Price Analysis: Bulls Defy Crushing Fear Index of 18 Amid Fragile Market Confidence

February 1, 2026 – Global cryptocurrency markets face extreme volatility as Monero (XMR) demonstrates remarkable resilience despite a crushing Fear and Greed Index reading of just 18. The privacy-focused cryptocurrency recently tested the critical $500 resistance level before retreating to its $450 support zone, creating a complex trading environment for investors navigating one of the most challenging market periods since the 2022 downturn. This analysis examines the technical and sentiment factors shaping Monero’s price action, its correlation with Bitcoin’s movements, and the key levels traders must monitor in the coming weeks.
Monero Price Action and Market Context
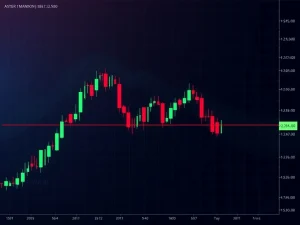
Monero experienced significant price movement on January 31, 2026, advancing to $500.87 before facing rejection. This represented an 8.72% increase from the day’s opening price, demonstrating brief bullish momentum. However, the rally proved unsustainable as Bitcoin faced renewed selling pressure, dropping below the psychologically important $80,000 level. The correlation between these movements highlights the continued dominance of Bitcoin sentiment across the broader cryptocurrency market.
Technical analysts note several important developments in Monero’s chart patterns. The cryptocurrency maintains a bullish swing structure on daily timeframes despite recent volatility. Specifically, XMR continues to defend the 61.8% Fibonacci retracement level, a key technical indicator watched by institutional and retail traders alike. This defense occurs amid severe market-wide selling pressure that has tested multiple support levels across major cryptocurrencies.
Extreme Fear Dominates Cryptocurrency Sentiment
The cryptocurrency Fear and Greed Index currently registers at 18, indicating extreme fear among market participants. This sentiment measurement aggregates multiple data points including volatility, market momentum, social media sentiment, and trading volume. Historical data shows that readings below 20 typically correspond with significant market bottoms, though they can persist for extended periods during bear markets.
Several factors contribute to the current fearful sentiment. Bitcoin approaches its weekly swing low at $74,000, a critical support level that market participants widely monitor. A breach below this level could signal the beginning of a broader bear market according to technical analysis principles. Additionally, the Money Flow Index (MFI) for Monero shows bearish momentum and capital outflow, while the Accumulation/Distribution (A/D) indicator has fallen to new lows, confirming substantial selling pressure.
Technical Indicators and Liquidity Analysis
Multiple technical indicators provide conflicting signals for Monero traders. The 1-month liquidation heatmap reveals two significant liquidity clusters that act as magnetic zones for price action. The first cluster sits between $400 and $415, while the second appears at $500. These zones represent areas where large numbers of stop-loss orders typically accumulate, creating potential reversal points when tested.
Key technical levels to monitor include:
- $450 Support: Current defense level showing bull resilience
- $415-$400 Zone: Next major support cluster with high liquidity
- $500 Resistance: Recent rejection point with historical significance
- $560-$580 Range: Previous all-time high territory requiring substantial momentum to breach
Trading volume analysis reveals important patterns. The relatively high trading volume during Monero’s descent from all-time highs suggests institutional participation in the selling pressure. However, the maintained bullish structure on higher timeframes indicates that longer-term investors continue to hold positions despite short-term volatility.
Bitcoin Correlation and Market-Wide Impacts
Bitcoin’s performance remains the primary driver of altcoin movements, including Monero’s price action. The world’s largest cryptocurrency currently tests the $74,000 support level after failing to maintain momentum above $80,000. This represents a critical juncture for the entire digital asset market, as Bitcoin historically leads both rallies and corrections across the sector.
The correlation coefficient between Bitcoin and Monero has remained consistently positive throughout 2025 and into 2026. This relationship means that significant Bitcoin movements typically produce proportional reactions in Monero’s price. Market analysts emphasize that Bitcoin’s ability to hold the $74,000 level will likely determine short-term direction for most altcoins, including privacy-focused assets like Monero.
Several macroeconomic factors contribute to current market conditions. Regulatory developments, institutional adoption rates, and global economic indicators all influence cryptocurrency valuations. The privacy features that distinguish Monero from other cryptocurrencies create both unique opportunities and specific regulatory challenges that can affect its price independently of broader market movements.
Trading Strategy Considerations for Current Conditions
Monero presents a complex scenario for swing traders and position investors. The cryptocurrency does not currently offer clear buy or sell signals according to traditional technical analysis frameworks. This ambiguity stems from conflicting indicators: bullish higher-timeframe structure versus bearish momentum readings and extreme fear sentiment.
Experienced traders suggest several approaches to navigating this environment. First, waiting for a sweep of either the $400-$415 or $500 liquidity zones could provide clearer entry signals. Second, monitoring Bitcoin’s $74,000 level remains crucial, as a breakdown would increase risk for all long positions in altcoins. Third, the 61.8% Fibonacci retracement level that Monero continues to defend represents a critical technical threshold that could determine medium-term direction.
Risk management becomes particularly important during periods of extreme fear and high volatility. Position sizing, stop-loss placement, and portfolio diversification all require careful consideration when the Fear and Greed Index registers below 20. Historical data indicates that such periods often precede significant market movements in either direction.
Privacy Coin Sector Analysis and Monero’s Position
Monero operates within the specialized privacy coin sector, which faces unique regulatory and adoption challenges. Unlike transparent blockchain networks, Monero utilizes advanced cryptographic techniques to obscure transaction details, providing enhanced privacy for users. This feature creates both dedicated support from privacy advocates and increased scrutiny from regulatory bodies worldwide.
The privacy coin sector has demonstrated both correlation with and divergence from broader cryptocurrency markets. During periods of regulatory uncertainty, privacy-focused assets often experience amplified volatility. Conversely, when privacy concerns dominate public discourse, these cryptocurrencies can outperform their transparent counterparts. Monero maintains the largest market capitalization within this sector, giving it particular significance for analysts tracking privacy-focused digital assets.
Recent developments in blockchain surveillance technology and regulatory frameworks continue to shape the privacy coin landscape. Exchange listing policies, merchant adoption rates, and technological advancements all influence Monero’s fundamental valuation beyond pure price speculation. These factors combine with technical analysis to create a comprehensive picture of the cryptocurrency’s potential trajectory.
Conclusion
Monero’s current price action reflects the broader cryptocurrency market’s struggle with extreme fear and uncertainty. The privacy-focused asset demonstrates technical resilience by defending key Fibonacci levels despite a Fear and Greed Index reading of just 18. However, fragile confidence among market participants and strong correlation with Bitcoin’s movements create a challenging environment for traders. The $450 support level and $500 resistance zone will likely determine short-term direction, while Bitcoin’s ability to hold $74,000 remains the dominant macro factor. This Monero price analysis reveals a cryptocurrency at a critical juncture, balancing technical strength against overwhelming market fear as 2026 unfolds.
FAQs
Q1: What does a Fear and Greed Index reading of 18 mean for cryptocurrency markets?
A reading of 18 indicates extreme fear among market participants. Historically, such extreme readings often precede market reversals, though they can persist during extended bear markets. This sentiment measurement considers multiple factors including volatility, social media sentiment, and trading volume.
Q2: Why is the $74,000 Bitcoin level so important for altcoins like Monero?
Bitcoin remains the dominant cryptocurrency by market capitalization and trading volume. Its price movements typically lead the broader market. The $74,000 level represents a critical weekly support; a breakdown could signal a broader bear market that would likely affect all cryptocurrencies including Monero.
Q3: What are liquidity pockets or clusters in cryptocurrency trading?
Liquidity pockets are price zones where large numbers of stop-loss orders accumulate. When price approaches these zones, it often experiences accelerated movement as these orders execute. The $400-$415 and $500 zones represent such liquidity clusters for Monero according to current heatmap data.
Q4: How does Monero’s privacy focus affect its price compared to other cryptocurrencies?
Monero’s enhanced privacy features create both opportunities and challenges. Privacy advocates may support it during increased surveillance concerns, while regulatory scrutiny can create selling pressure. This can cause both correlation with and divergence from broader market movements.
Q5: What technical indicators are most relevant for analyzing Monero’s current price action?
Key indicators include the 61.8% Fibonacci retracement level (currently being defended), the Money Flow Index (showing bearish momentum), liquidation heatmaps (revealing $400-$415 and $500 clusters), and daily chart swing structure (remaining bullish despite volatility).