Crypto Futures Liquidation Crisis: $269 Million Wiped in One Hour as Markets Reel

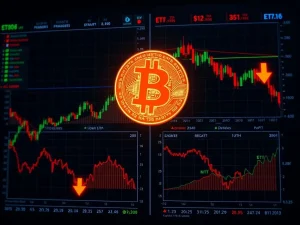
Global cryptocurrency markets experienced a severe liquidity shock on March 15, 2025, as major exchanges reported $269 million in futures positions forcibly closed within a single hour. This dramatic event triggered widespread market concern and highlighted the inherent risks of leveraged trading. Furthermore, the broader 24-hour liquidation total reached a staggering $1.221 billion, marking one of the most significant deleveraging events of the year and sending ripples through digital asset portfolios worldwide.
Crypto Futures Liquidation Crisis Explained
The recent $269 million futures liquidation represents a forced closure of leveraged derivative contracts. Exchanges automatically execute these liquidations when traders’ collateral falls below maintenance margin requirements. Consequently, this process creates cascading sell pressure in spot markets. Major platforms like Binance, Bybit, and OKX typically experience the highest volumes during such events. Historically, liquidations of this magnitude often correlate with extreme price volatility and rapid market movements.
Market analysts immediately noted the concentration of these liquidations. Specifically, long positions accounted for approximately 85% of the hourly total. This indicates that most traders were betting on price increases when the market moved against them. The Bitcoin futures market bore the brunt of the damage, contributing nearly 70% of the liquidated value. Meanwhile, Ethereum and other major altcoins comprised the remaining portion.
Analyzing the $1.2 Billion 24-Hour Liquidation Wave
The one-hour liquidation spike formed part of a much larger 24-hour deleveraging event totaling $1.221 billion. This extended timeframe provides crucial context for understanding market dynamics. Typically, such substantial liquidation clusters occur during pronounced trend reversals or following major macroeconomic announcements. The 24-hour figure suggests sustained selling pressure rather than an isolated flash crash.
Historical Comparison and Market Impact
Comparing this event to historical precedents reveals its significance. For instance, the May 2021 market correction saw over $8 billion in liquidations within 24 hours. Similarly, the November 2022 FTX collapse triggered approximately $3 billion in liquidations. While the current $1.2 billion figure remains smaller, its concentration within a short period demonstrates intense volatility. Market impact extends beyond derivative markets, often affecting spot prices and investor sentiment across the ecosystem.
Exchange data shows clear patterns during these events. Liquidations frequently cluster around key price levels where many traders place stop-loss orders. As prices breach these levels, automated systems trigger sell orders, creating a self-reinforcing cycle. This phenomenon, known as liquidation cascades, can accelerate price declines beyond fundamental valuations. Market makers and institutional traders often adjust their strategies in response to such volatility spikes.
Understanding Leveraged Trading Risks
Leveraged trading amplifies both potential profits and losses through borrowed funds. Traders commonly use leverage ratios from 5x to 100x on various platforms. However, higher leverage increases liquidation risk exponentially. The recent $269 million liquidation demonstrates how quickly positions can unravel during adverse price movements. Risk management practices become critically important in such environments.
- Margin Requirements: Exchanges require initial and maintenance margins
- Funding Rates: Periodic payments between long and short positions
- Liquidation Engines: Automated systems that close positions
- Price Oracles: External price feeds determining liquidation triggers
Market structure plays a crucial role in liquidation events. Different exchanges use varying methodologies for calculating liquidation prices. Some platforms employ partial liquidation systems, while others close entire positions at once. Additionally, cross-margin and isolated margin accounts face different risk profiles. Understanding these mechanics helps traders navigate volatile conditions more effectively.
Market Context and Contributing Factors
Several factors likely contributed to the liquidation event. First, Bitcoin’s price had approached a key resistance level around $72,000 before reversing sharply. Second, traditional market volatility increased following Federal Reserve policy announcements. Third, cryptocurrency funding rates had reached elevated levels, indicating excessive bullish sentiment. Finally, options market data showed concentrated gamma exposure at specific strike prices.
The timing of the liquidation wave coincided with reduced liquidity in Asian trading hours. Typically, lower trading volumes during specific sessions can exacerbate price movements. Market participants also noted unusual activity in perpetual swap markets preceding the event. These contracts, which lack expiration dates, often serve as indicators of market sentiment and positioning.
Regulatory and Institutional Perspectives
Financial regulators monitor liquidation events for systemic risk assessment. The Commodity Futures Trading Commission (CFTC) and Securities and Exchange Commission (SEC) track derivatives market activity closely. Institutional investors typically employ more sophisticated risk management than retail traders. However, even large funds can face challenges during extreme volatility episodes. The growth of cryptocurrency exchange-traded funds (ETFs) has created additional connections between derivatives and traditional markets.
Market infrastructure has evolved significantly since previous liquidation crises. Exchanges now implement circuit breakers and volatility controls in some jurisdictions. Insurance funds and auto-deleveraging mechanisms aim to mitigate cascade effects. Despite these improvements, fundamental market forces continue to drive periodic deleveraging events. The relationship between spot and derivatives markets remains complex and interconnected.
Technical Analysis and Price Action
Technical indicators provided warning signals before the liquidation event. The Bitcoin Fear and Greed Index had entered “extreme greed” territory. Meanwhile, moving average convergence divergence (MACD) showed bearish divergence on higher timeframes. Relative strength index (RSI) readings approached overbought levels across multiple assets. These technical conditions created a vulnerable market environment.
Price action following the liquidation revealed important market characteristics. Bitcoin initially found support around $68,500 before attempting recovery. The speed of the decline exceeded typical daily volatility ranges, triggering multiple liquidation thresholds. Market depth on major exchanges temporarily diminished as market makers widened spreads. Order book analysis showed substantial sell walls forming at key resistance levels during the recovery attempt.
Risk Management Strategies for Traders
Professional traders employ specific strategies to navigate liquidation events. Position sizing becomes paramount during high-volatility periods. Many experienced traders reduce leverage or exit positions before major economic announcements. Diversification across uncorrelated assets can provide portfolio protection. Additionally, using options for downside protection represents a common hedge against liquidation risk.
Advanced traders monitor several key metrics for early warning signs. Funding rate anomalies often precede market reversals. Open interest changes can indicate shifting market sentiment. Exchange heatmaps showing liquidation price clusters help identify vulnerable levels. By combining these tools with fundamental analysis, traders can better anticipate potential volatility spikes.
Conclusion
The $269 million crypto futures liquidation within one hour, alongside the $1.221 billion 24-hour total, underscores the volatile nature of cryptocurrency markets. This event highlights the risks associated with leveraged trading and the interconnectedness of derivatives and spot markets. While market infrastructure has improved, periodic deleveraging events remain inherent to cryptocurrency trading. Understanding liquidation mechanics, maintaining proper risk management, and monitoring market indicators provide essential protection for market participants navigating these dynamic conditions.
FAQs
Q1: What causes futures liquidations in cryptocurrency markets?
Futures liquidations occur when a trader’s position loses enough value that their collateral no longer covers potential losses. Exchanges automatically close these positions to prevent negative balances, often during rapid price movements against the trader’s direction.
Q2: How does the $269 million liquidation compare to historical events?
While substantial, this event remains smaller than major historical liquidations. The May 2021 correction saw over $8 billion in liquidations, and the November 2022 FTX collapse triggered about $3 billion. However, the concentration within one hour makes it significant.
Q3: Do liquidations primarily affect long or short positions?
In this specific event, approximately 85% of liquidations affected long positions. This indicates most traders were betting on price increases when the market moved downward. The distribution varies depending on market direction.
Q4: Can liquidation events create buying opportunities?
Some traders view extreme liquidation events as potential buying opportunities, as forced selling can push prices below fundamental values. However, this strategy carries significant risk, as liquidation cascades can continue beyond expected levels.
Q5: How can traders protect against liquidation risk?
Traders can employ several protective measures: using lower leverage ratios, maintaining adequate margin buffers, setting stop-loss orders, diversifying portfolios, hedging with options, and avoiding overconcentration in single positions during high-volatility periods.