Cardano’s Critical Juncture: ADA Faces Alarming 25% Crash Risk at Key Support Level
As global cryptocurrency markets navigate volatile conditions in early 2026, Cardano’s native token ADA approaches a critical technical threshold that could determine its near-term trajectory. The digital asset currently trades at $0.3251, representing a 7.70% decline over the past 24 hours despite a 72% surge in trading volume to $831 million. This divergence between price action and market participation signals heightened attention from traders and investors worldwide, particularly as ADA tests a support level that has held since November 2023.
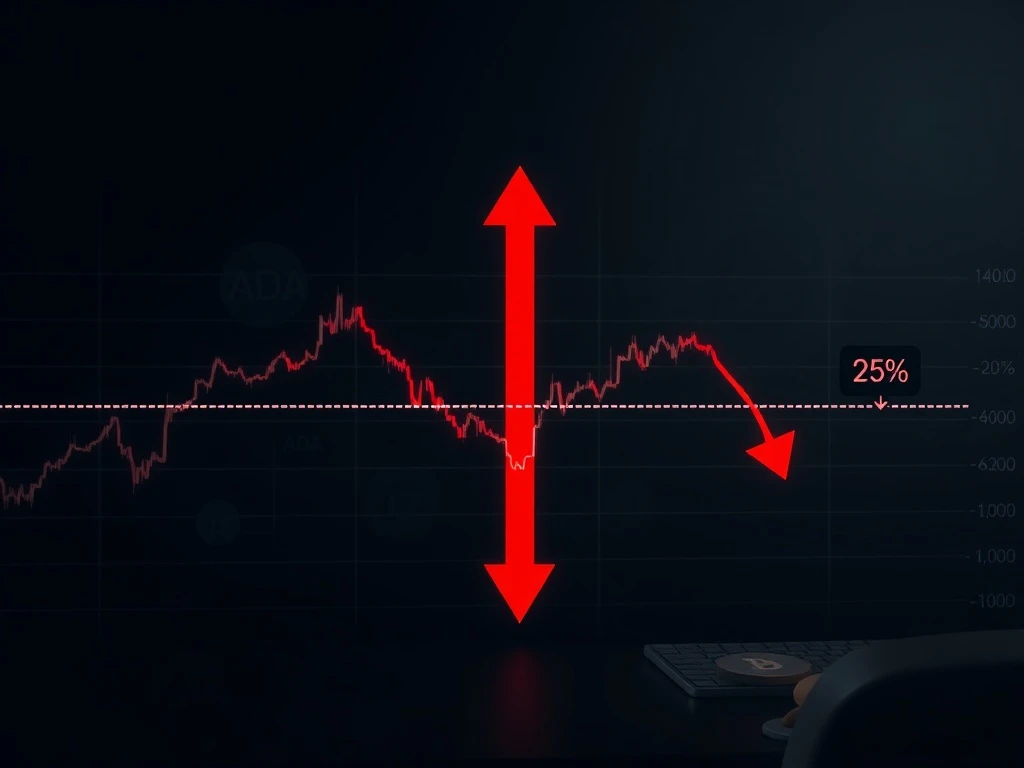
Cardano’s Technical Make-or-Break Moment
Technical analysis reveals ADA’s current position represents a pivotal zone for the cryptocurrency. The $0.315 level has served as reliable support for over two years, with price reversals occurring five separate times when ADA approached this threshold. Historical performance suggests maintaining this support could trigger another reversal, while breaking below it might initiate a 25% decline toward $0.2329. Market technicians emphasize this represents one of ADA’s most significant technical tests in recent memory.
Several key indicators provide context for ADA’s current situation. The Average Directional Index (ADX) measures trend strength at 27.05, exceeding the 25 threshold that typically indicates strong directional momentum. Meanwhile, the Money Flow Index (MFI) registers at 32.17, suggesting weakening buying pressure and approaching oversold conditions. This combination creates potential for either continued decline or technical bounce, depending on whether support holds.
Market Structure and Historical Precedents
Cardano’s blockchain development continues progressing with regular protocol upgrades and ecosystem expansion. However, cryptocurrency markets frequently decouple from fundamental developments during periods of technical stress. ADA’s current challenge mirrors patterns observed in previous market cycles where established support levels either catalyzed recoveries or accelerated declines. The concentration of trading activity around current prices indicates market participants recognize the significance of this moment.
On-Chain Data Reveals Diverging Sentiment
Despite bearish price action, on-chain metrics reveal complex underlying dynamics. CryptoQuant data shows Spot Taker CVD remaining positive for multiple consecutive days, indicating sustained market buying at current prices. This divergence between declining prices and persistent demand suggests accumulation may be occurring beneath surface-level volatility. Such patterns historically precede significant price movements in either direction.
Santiment’s wallet analysis provides additional insight into market participant behavior. Whales holding between 100,000 and 100 million ADA have accumulated 454.7 million tokens worth approximately $161 million over the past two weeks. Simultaneously, wallets containing at least 100 ADA have sold over 22,000 tokens during the same period. This divergence between institutional and retail behavior highlights differing risk assessments amid market uncertainty.
The Whale Accumulation Pattern
Large-scale accumulation during price declines represents a established pattern in cryptocurrency markets. Historical data shows whale accumulation often precedes significant price movements, though timing remains unpredictable. The scale of recent ADA accumulation suggests sophisticated investors perceive value at current levels, potentially establishing a foundation for future price appreciation if broader market conditions stabilize.
Derivatives Market Positioning and Liquidation Risks
Derivatives traders have positioned themselves around key technical levels, according to CoinGlass data. Approximately $2.47 million in long-leveraged positions concentrate around the $0.319 support level, while $10 million in short positions cluster near $0.341 resistance. This positioning creates potential liquidation cascades if prices move decisively in either direction, potentially amplifying volatility around critical thresholds.
Liquidation concentrations represent both risk and opportunity for ADA’s price discovery process. High leverage positions increase market fragility during technical tests, potentially accelerating moves beyond fundamental justification. However, these same concentrations can create vacuum effects when liquidations occur, sometimes triggering rapid reversals as overextended positions unwind.
Market Mechanics and Price Discovery
Modern cryptocurrency markets integrate spot trading, derivatives, and decentralized finance mechanisms that collectively influence price discovery. ADA’s current situation demonstrates how technical levels interact with leveraged positioning to create potential inflection points. Understanding these mechanics helps contextualize why specific price thresholds carry disproportionate significance beyond simple chart patterns.
Broader Cryptocurrency Market Context
Cardano’s technical test occurs within a complex global cryptocurrency landscape. Regulatory developments, macroeconomic conditions, and cross-market correlations all influence ADA’s price action independently of its specific technical setup. The cryptocurrency sector continues maturing, with institutional participation increasing despite periodic volatility episodes.
Several factors distinguish the current market environment from previous cycles. Regulatory clarity has improved in multiple jurisdictions, though uncertainty persists in others. Institutional adoption continues expanding through exchange-traded products and corporate treasury allocations. Technological advancements across blockchain networks create both competitive pressure and collaborative opportunities for ecosystems like Cardano.
Comparative Asset Performance
While ADA faces specific technical challenges, broader cryptocurrency market performance provides important context. Major assets including Bitcoin and Ethereum have experienced similar volatility periods throughout their histories, with successful navigation of critical support levels often preceding extended recovery phases. Historical patterns suggest well-established projects with active development frequently recover from technical breakdowns, though timing and magnitude remain unpredictable.
Cardano Ecosystem Development Fundamentals
Beyond price action, Cardano’s underlying ecosystem continues evolving. The network’s proof-of-stake consensus mechanism, decentralized governance model, and research-driven development approach distinguish it within the competitive blockchain landscape. Recent upgrades have enhanced scalability, interoperability, and smart contract capabilities, though market prices don’t always immediately reflect fundamental progress.
Several key metrics provide perspective on Cardano’s ecosystem health:
- Network Activity: Daily transactions and active addresses indicate real-world usage
- Development Activity: GitHub commits and protocol improvements demonstrate ongoing innovation
- Decentralization Metrics: Stake distribution and node participation measure network resilience
- Ecosystem Expansion: dApp deployment and partnership announcements reveal adoption progress
The Fundamental-Technical Disconnect
Cryptocurrency markets frequently experience periods where price action diverges from fundamental developments. This disconnect creates opportunities for informed investors but challenges short-term traders. ADA’s current technical test exemplifies how market psychology and positioning can temporarily override fundamental progress, though historical patterns suggest fundamentals typically reassert influence over extended timeframes.
Risk Management Considerations for Market Participants
Navigating volatile market conditions requires disciplined risk management regardless of directional bias. Several principles apply particularly to ADA’s current technical situation. Position sizing should account for increased volatility around critical levels, while stop-loss placement requires careful consideration of liquidation concentrations. Diversification across timeframes and strategies can mitigate single-point failure risks during technical inflection periods.
Market participants should also consider multiple scenario planning. Technical breakdowns don’t guarantee extended declines, just as support holds don’t ensure immediate rallies. Probabilistic thinking incorporating both technical and fundamental factors typically produces more robust decision-making than binary predictions. Historical volatility patterns suggest preparing for multiple outcomes remains prudent during technical tests.
Psychological Factors in Market Inflection Points
Market psychology plays a significant role during technical inflection points. Fear and greed dynamics often amplify around critical levels, creating self-reinforcing price movements. Recognizing these psychological patterns helps maintain perspective during volatile periods. Historical analysis suggests emotional extremes frequently coincide with technical extremes, creating potential opportunities for contrarian positioning when supported by fundamental analysis.
Conclusion
Cardano’s ADA approaches a critical technical juncture with the $0.315 support level representing a potential make-or-break threshold. A breakdown below this level could trigger a 25% decline toward $0.2329, while successful defense might catalyze the next recovery phase. On-chain data reveals whale accumulation amid retail selling, creating complex sentiment dynamics. Derivatives positioning adds potential volatility amplification around key levels. Ultimately, ADA’s near-term trajectory will likely resolve through the interaction of technical factors, market positioning, and broader cryptocurrency market conditions. Market participants should monitor price action around critical levels while maintaining perspective on Cardano’s continued fundamental development regardless of short-term volatility.
FAQs
Q1: What specific price level represents critical support for Cardano’s ADA?
The $0.315 level represents ADA’s critical support threshold. This price has held since November 2023 and triggered five separate reversals when tested historically.
Q2: How much could ADA decline if it breaks below key support?
Technical analysis suggests a 25% decline toward $0.2329 could occur if ADA sustains a daily close below $0.315 support. This projection derives from historical volatility patterns and chart structure analysis.
Q3: What on-chain indicators suggest accumulation despite price declines?
Spot Taker CVD has remained positive for multiple days, indicating sustained buying at market prices. Additionally, whale wallets have accumulated over 454 million ADA worth approximately $161 million during recent weeks.
Q4: How do derivatives positions influence ADA’s price action around critical levels?
Approximately $12.47 million in leveraged positions concentrate around $0.319 support and $0.341 resistance. These concentrations create potential liquidation cascades that could amplify volatility during technical tests.
Q5: What broader factors beyond technical analysis influence ADA’s price trajectory?
Regulatory developments, macroeconomic conditions, cross-market correlations, Cardano ecosystem progress, and overall cryptocurrency market sentiment all influence ADA’s price action alongside technical factors.