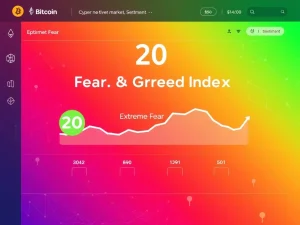
Crypto Fear & Greed Index Climbs to 20: A Hopeful Sign Amid Lingering Market Anxiety
Global cryptocurrency markets show tentative signs of life as the widely watched Crypto Fear & Greed Index climbs four points to 20 this week, marking a subtle but notable shift in investor psychology after prolonged bearish pressure. This movement, while keeping the market firmly in “Extreme Fear” territory according to Alternative’s metrics, represents the first upward momentum in three consecutive weeks, suggesting potential stabilization. Market analysts closely monitor this sentiment indicator because it often precedes price movements, providing crucial insights into collective trader behavior across major exchanges worldwide.
Crypto Fear & Greed Index Rises to 20: Decoding the Numbers
The Crypto Fear & Greed Index serves as a crucial barometer for digital asset markets. This proprietary metric, developed by data provider Alternative, quantifies market sentiment on a scale from 0 to 100. Consequently, a reading of 20 indicates persistent fear dominates trading decisions. However, the four-point increase from 16 demonstrates measurable improvement in several underlying factors. Specifically, the index calculation incorporates six weighted components that reflect different market dimensions.
Market volatility contributes 25% to the final score, while market momentum and volume account for another 25%. Social media sentiment analysis comprises 15%, matching the weight given to survey data from retail and institutional investors. Additionally, Bitcoin’s dominance within the total cryptocurrency market capitalization influences 10% of the score. Finally, Google search trends for cryptocurrency-related terms complete the remaining 10%. This multi-factor approach prevents any single metric from distorting the overall sentiment picture.
The Anatomy of Market Sentiment Measurement
Understanding each component reveals why the index moved upward. First, volatility metrics showed slight stabilization compared to previous weeks. Major cryptocurrencies like Bitcoin and Ethereum experienced reduced daily price swings. Second, trading volume increased moderately across leading exchanges, suggesting renewed, albeit cautious, participation. Third, social media analysis detected a subtle reduction in negative sentiment across platforms like Twitter and Reddit. Fourth, survey data indicated slightly less pessimism among sampled investors.
Fifth, Bitcoin’s market dominance remained relatively stable around 42%, indicating neither extreme flight to safety nor aggressive altcoin rotation. Sixth, Google search volume for terms like “crypto crash” and “Bitcoin price” decreased slightly, while searches for “crypto recovery” showed minimal increases. These combined factors produced the four-point index increase. Historical data reveals that readings below 25 typically correspond with accumulation phases, while readings above 75 often signal potential market tops.
Historical Context and Market Psychology
The Crypto Fear & Greed Index provides valuable historical perspective. During the 2021 bull market peak, the index reached extreme greed levels above 90. Conversely, during major corrections like May 2022’s Terra collapse, it plunged to single digits. The current 20 reading places markets in familiar territory seen during previous consolidation periods. Market psychologists note that sustained extreme fear often creates contrarian buying opportunities. However, they caution that sentiment indicators alone shouldn’t drive investment decisions.
Previous recoveries typically followed a pattern. First, the index would stabilize in extreme fear territory. Next, it would gradually climb through fear and neutral zones. Finally, it would accelerate into greed territory during strong rallies. The current movement represents potential phase one of this process. Comparative analysis shows similar patterns emerged in early 2019 and mid-2020 before significant upward movements. Nevertheless, macroeconomic factors including interest rate policies and regulatory developments continue influencing cryptocurrency markets substantially.
Expert Analysis and Institutional Perspective
Financial institutions increasingly incorporate sentiment analysis into cryptocurrency strategies. Goldman Sachs’ digital asset research team recently published findings correlating the Fear & Greed Index with institutional flow data. Their analysis suggests sentiment indicators often lead price movements by one to two weeks. Meanwhile, Fidelity Digital Assets includes sentiment metrics in their monthly market reviews. Their researchers note that extreme fear readings frequently coincide with increased stablecoin reserves on exchanges, potentially indicating prepared buying power.
University researchers contribute additional insights. A Cambridge Centre for Alternative Finance study examined sentiment data across market cycles. Their findings indicate that sentiment recovery typically begins with reduced volatility before price appreciation follows. Another Stanford University analysis identified social media sentiment as the most reactive component, often overshooting in both directions. These academic perspectives help contextualize the current four-point index increase as potentially meaningful despite remaining in extreme fear territory.
Component Breakdown and Weighted Analysis
The Crypto Fear & Greed Index’s methodology provides transparency into market dynamics. Each component receives specific weighting based on historical correlation with market movements:
- Volatility (25%): Measures price fluctuations compared to historical averages
- Market Momentum/Volume (25%): Analyzes trading activity and price trends
- Social Media (15%): Tracks sentiment across major platforms
- Surveys (15%): Collects direct investor sentiment data
- Bitcoin Dominance (10%): Measures Bitcoin’s market share
- Google Trends (10%): Analyzes search interest patterns
This week’s improvement primarily stemmed from volatility reduction and volume increases. Social media sentiment showed marginal improvement. Survey data indicated slightly reduced pessimism. Bitcoin dominance remained stable. Google search trends showed decreased panic searching. The balanced improvement across multiple components suggests genuine sentiment shift rather than single-factor anomaly.
Comparative Market Analysis
Traditional financial markets provide interesting comparisons. The VIX volatility index, often called Wall Street’s “fear gauge,” shows similar patterns during market transitions. When the VIX declines from extreme highs, equity markets often stabilize. The Crypto Fear & Greed Index functions similarly for digital assets. Current readings show cryptocurrency sentiment remains more fearful than traditional markets. This divergence creates potential opportunities according to some analysts. However, others note cryptocurrency’s higher inherent volatility justifies more cautious sentiment.
Regional differences also emerge in sentiment data. Asian markets often show different patterns than European or American markets. Time zone analysis reveals sentiment frequently improves during Asian trading hours. This week’s data showed particular strength in Asian market sentiment. European markets demonstrated moderate improvement. American markets showed minimal change. These geographical variations highlight cryptocurrency’s global nature while revealing regional psychological differences among investors.
Practical Implications for Investors
The Crypto Fear & Greed Index rising to 20 carries practical implications. First, it suggests reduced panic selling pressure. Second, it indicates potential accumulation opportunities. Third, it signals possible market stabilization. However, experienced investors emphasize several crucial considerations. They recommend combining sentiment analysis with fundamental and technical analysis. They also suggest dollar-cost averaging during extreme fear periods. Furthermore, they caution against overreacting to single data points.
Portfolio managers note specific behavioral patterns. Retail investors often exhibit maximum fear near market bottoms. Institutional investors frequently increase positions during these periods. The current sentiment reading suggests we may approach such conditions. Historical data supports this perspective. During previous cycles, sustained readings below 25 preceded significant rallies. However, external factors including regulatory developments and macroeconomic conditions significantly influence outcomes.
Risk Management Considerations
Professional traders emphasize risk management regardless of sentiment readings. They recommend position sizing appropriate for current volatility. They also suggest setting clear entry and exit points. Furthermore, they advocate for portfolio diversification beyond cryptocurrencies. The current sentiment improvement warrants cautious optimism rather than aggressive positioning. Market veterans recall that sentiment can reverse quickly. Therefore, they maintain disciplined risk parameters even during potential recovery phases.
Technical analysts examine price action alongside sentiment. They note that Bitcoin recently tested and held key support levels. This price action aligns with improving sentiment readings. However, they await confirmation through resistance breaks before declaring trend changes. This balanced approach combines multiple analytical methods. It avoids overreliance on any single indicator while acknowledging improving conditions.
Conclusion
The Crypto Fear & Greed Index rising to 20 represents a meaningful development in cryptocurrency market psychology. This four-point increase signals reduced extreme pessimism despite remaining in fear territory. The improvement across multiple index components suggests genuine sentiment shift rather than statistical noise. Historical patterns indicate such movements often precede market stabilization phases. However, investors should consider this data alongside fundamental and technical analysis. The index provides valuable psychological insights but doesn’t guarantee specific price outcomes. Continued monitoring of sentiment indicators alongside macroeconomic developments remains essential for informed decision-making in dynamic cryptocurrency markets.
FAQs
Q1: What does a Crypto Fear & Greed Index reading of 20 mean?
The reading of 20 indicates the market remains in “Extreme Fear” territory but has improved from previous levels. It suggests reduced pessimism among investors while still reflecting cautious sentiment overall.
Q2: How often does the Crypto Fear & Greed Index update?
The index updates daily, incorporating the most recent market data across all six components to provide current sentiment readings.
Q3: Can the Crypto Fear & Greed Index predict market movements?
While not predictive, the index often leads price movements by identifying sentiment shifts. Extreme readings frequently correspond with potential trend changes, though confirmation through price action remains essential.
Q4: How does this reading compare to historical levels?
A reading of 20 sits slightly above the extreme lows seen during major market crises but remains well below neutral levels of 50. It resembles readings from previous consolidation periods before rallies.
Q5: Should investors buy when the index shows extreme fear?
Extreme fear readings often present accumulation opportunities, but investors should combine sentiment analysis with other factors. Dollar-cost averaging during these periods represents a common strategy among experienced market participants.