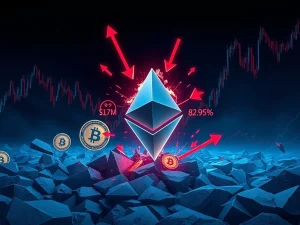
Gold Price Plummets 12% in Stunning Market Rout as Dollar Soars on Warsh Fed Nomination

Financial markets experienced a seismic shock on January 30, 2025, as precious metals collapsed amid a surging U.S. dollar, triggered directly by President Donald Trump’s confirmation of Kevin Warsh as his nominee for Federal Reserve Chair. The dramatic gold price drop of over 12% to below $5,000 per ounce, coupled with silver’s 36% plunge, represents one of the most significant single-day precious metals movements in recent financial history, according to Bloomberg market analysis.
Gold Price Plunge: Analyzing the January 30 Market Earthquake
The precious metals market witnessed unprecedented volatility following the White House announcement. Gold futures tumbled from approximately $5,700 to below $5,000 per ounce during the trading session. Similarly, silver prices collapsed from $75.40 to $48.25 per ounce, marking the largest single-day percentage decline since the 1980 Hunt Brothers silver crisis. Market analysts immediately identified the dollar’s sharp appreciation as the primary catalyst for this dramatic reversal.
Bloomberg’s real-time data showed the U.S. Dollar Index (DXY) surging 3.2% against a basket of major currencies. This dollar rally created immediate headwinds for dollar-denominated commodities like gold and silver. Consequently, international buyers faced significantly higher costs when converting their local currencies, reducing global demand pressure almost instantaneously.
Kevin Warsh Nomination: Market Interpretation and Immediate Reactions
President Trump’s selection of Kevin Warsh, a former Federal Reserve governor and Hoover Institution fellow, signaled a potential paradigm shift in U.S. monetary policy. Markets interpreted Warsh’s historical policy positions as fundamentally hawkish, particularly regarding inflation control and balance sheet normalization. His previous critiques of quantitative easing programs during the 2008 financial crisis recovery period suggested a more restrained approach to monetary stimulus.
Financial institutions reacted swiftly to the nomination news. Major investment banks, including Goldman Sachs and JPMorgan Chase, issued client notes highlighting Warsh’s potential policy directions. These analyses emphasized his likely focus on:
- Accelerated balance sheet reduction to combat inflationary pressures
- Higher terminal interest rates than previously projected
- Tighter monetary conditions through regulatory adjustments
- Reduced Fed intervention in financial markets during periods of stress
Historical Context: Warsh’s Policy Framework and Market Implications
Kevin Warsh served as a Federal Reserve governor from 2006 to 2011, providing crucial insight into his potential leadership approach. During the 2008 financial crisis, he frequently advocated for more measured intervention approaches compared to some colleagues. His academic writings at Stanford University’s Hoover Institution consistently emphasized market discipline and the dangers of prolonged monetary accommodation.
Market participants recalled Warsh’s 2015 Wall Street Journal op-ed where he criticized the Fed’s forward guidance as potentially distorting market signals. This historical perspective helps explain the dramatic market reaction. Traders anticipated that a Warsh-led Fed might:
| Policy Area | Expected Direction | Market Impact |
|---|---|---|
| Interest Rates | More aggressive hikes | Stronger dollar, lower gold |
| Balance Sheet | Faster reduction | Tighter liquidity |
| Communication | Less forward guidance | Increased volatility |
| Inflation Tolerance | Lower threshold | Earlier policy response |
Dollar Rally Mechanics: Understanding the Currency-Metals Relationship
The inverse relationship between the U.S. dollar and precious metals represents a fundamental market dynamic. When the dollar strengthens, commodities priced in dollars become more expensive for international buyers, typically reducing demand. The January 30 movement exemplified this relationship with exceptional clarity. Several factors contributed to the dollar’s dramatic appreciation:
First, interest rate expectations shifted substantially. Futures markets immediately priced in additional Federal Reserve rate hikes throughout 2025. Second, capital flows accelerated toward dollar-denominated assets as investors sought perceived safety amid policy uncertainty. Third, currency carry trades unwound rapidly as yield differential expectations changed.
Bloomberg’s analysis highlighted specific technical levels breached during the session. The dollar index broke through its 200-day moving average with unusual force, triggering algorithmic trading programs that exacerbated the move. This technical breakdown created a feedback loop that further pressured precious metals positions.
Market Structure Analysis: How Trading Dynamics Amplified the Move
The precious metals selloff gained momentum through specific market mechanisms. Exchange-traded funds (ETFs) tracking gold and silver experienced massive outflows exceeding $8 billion collectively. Margin calls forced leveraged positions to liquidate, creating additional downward pressure. Options markets showed extreme volatility, with gold volatility indices spiking to levels not seen since the 2013 taper tantrum.
Physical markets displayed interesting divergences from paper markets. While futures and ETF prices collapsed, physical bullion premiums in major markets like London and Zurich actually increased slightly. This discrepancy suggested that long-term holders maintained positions despite the paper market turmoil. Central bank buying patterns, particularly from emerging market institutions, showed no immediate signs of abatement according to World Gold Council preliminary data.
Comparative Analysis: Historical Precious Metals Corrections
The January 30 decline ranks among the most significant single-day precious metals movements in modern financial history. For context, consider these historical comparisons:
- 1980 Silver Crash: Silver fell 50% in four days during the Hunt Brothers squeeze unwinding
- 2011 Gold Peak: Gold declined 20% over several months after reaching $1,900/oz
- 2013 Taper Tantrum: Gold dropped 26% amid Fed quantitative easing reduction fears
- 2020 COVID Crash: Gold initially fell 12% during March liquidity crisis before recovering
Each historical episode featured different catalysts but shared common characteristics with the current situation. Market psychology shifted from inflationary hedging to deflationary concerns during liquidity events. Policy uncertainty created volatility spikes that overwhelmed normal trading patterns. The current episode uniquely combines monetary policy uncertainty with already elevated inflation concerns.
Sector Impact Analysis: Mining Stocks and Related Industries
The precious metals collapse immediately reverberated through related sectors. Major mining companies experienced severe stock price declines exceeding the underlying commodity drops due to operational leverage. Barrick Gold Corporation shares fell 18%, while Newmont Corporation declined 16%. Junior mining companies with higher cost structures faced even steeper declines, with some dropping over 30% during the session.
Silver-intensive industries presented a more complex picture. Solar panel manufacturers, which consume substantial silver for photovoltaic cells, potentially benefited from lower input costs. However, semiconductor companies faced mixed impacts as industrial silver demand concerns offset potential cost benefits. The electronic manufacturing sector monitored the situation closely, as silver represents a critical component in many electronic devices.
Global Central Bank Response and International Implications
International monetary authorities closely monitored the situation following the dramatic moves. The European Central Bank and Bank of Japan faced immediate currency pressure as their currencies weakened against the surging dollar. Emerging market central banks with substantial dollar-denominated debt watched carefully, as dollar strength increases their debt servicing costs.
Gold-holding nations displayed varied responses. Russia and China, both substantial gold accumulators in recent years, maintained their long-term strategic positions according to official statements. Turkey, facing domestic inflation challenges, potentially benefited from lower gold import costs despite currency pressures. The International Monetary Fund issued a standard monitoring statement but took no immediate policy actions.
Investor Psychology and Market Sentiment Shifts
The dramatic price movements fundamentally altered precious metals market sentiment. The CNN Fear & Greed Index for commodities shifted from “Extreme Greed” to “Fear” within a single trading session. Investor surveys conducted by major financial institutions showed the most rapid sentiment shift since the 2008 financial crisis. Several factors contributed to this psychological transformation:
First, the nomination challenged the prevailing inflation hedge narrative that had supported gold prices above $5,000. Second, technical breakdowns triggered systematic selling from quantitative funds. Third, media coverage amplified the sense of crisis, with financial networks providing continuous coverage of the plunging prices. Fourth, social media sentiment turned overwhelmingly negative, with precious metals communities expressing shock and concern.
Regulatory Considerations and Market Oversight Response
Financial regulators monitored the situation for potential market disruptions. The Commodity Futures Trading Commission (CFTC) reviewed trading data for unusual patterns, though no immediate irregularities were reported. Exchange operators like CME Group implemented standard volatility controls, including expanded price limits for precious metals futures. These mechanisms functioned as designed, preventing a complete market breakdown despite the extreme movements.
Market structure proved resilient throughout the event. Clearinghouses maintained adequate margin coverage, and settlement processes continued normally. This operational stability contrasted with the price volatility, demonstrating improvements in financial market infrastructure since previous crisis episodes. Regulatory post-mortem analyses will likely examine whether current circuit breaker mechanisms adequately address such policy-driven volatility.
Conclusion
The dramatic gold price plunge and corresponding silver collapse on January 30, 2025, demonstrated the profound sensitivity of financial markets to Federal Reserve leadership expectations. Kevin Warsh’s nomination triggered immediate repricing of monetary policy expectations, strengthening the dollar and pressuring dollar-denominated assets. This episode highlights the continuing importance of central bank communication and policy signals in global financial markets. Market participants now face a new paradigm where monetary policy uncertainty may drive increased volatility across asset classes, particularly for traditional safe havens like gold and silver that had reached historically elevated valuation levels.
FAQs
Q1: Why did gold and silver prices fall so dramatically on January 30?
The primary catalyst was a surging U.S. dollar following President Trump’s nomination of Kevin Warsh for Federal Reserve Chair. Markets interpreted this selection as signaling tighter future monetary policy, strengthening the dollar and making dollar-denominated commodities like gold and silver more expensive for international buyers.
Q2: How does Kevin Warsh’s potential Fed leadership differ from current policy?
Based on his previous writings and Fed service, Warsh has historically advocated for more restrained monetary intervention, faster balance sheet reduction, and higher interest rates to combat inflation. Markets anticipated these hawkish tendencies would lead to tighter monetary conditions than previously expected.
Q3: Did physical gold demand change during the price collapse?
While paper gold markets (ETFs, futures) experienced massive selling, physical bullion markets showed more stability. Premiums for physical gold bars and coins actually increased slightly in major markets, suggesting long-term holders maintained positions despite the paper market volatility.
Q4: How does this decline compare to historical precious metals crashes?
The 12% single-day gold decline ranks among the most significant movements since the 1980s, though smaller than the 1980 silver crash. The 36% silver plunge represents the largest single-day percentage decline since the Hunt Brothers squeeze unwinding, though the absolute price context differs substantially.
Q5: What are the implications for investors holding precious metals?
Investors should recognize increased volatility potential during monetary policy transitions. The episode demonstrates how quickly sentiment can shift based on central bank leadership changes. Diversification and position sizing become increasingly important in such environments, as traditional hedging relationships can break down during policy shocks.