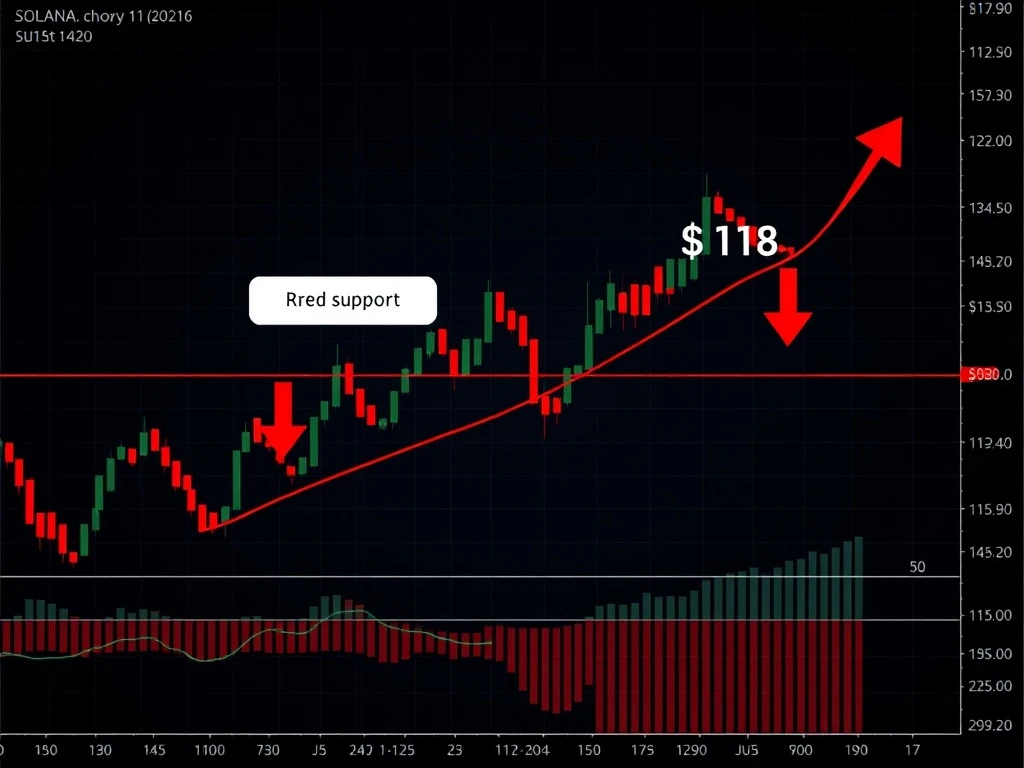
Solana Plummets: Critical $118 Support Break Sparks Fears of 30% Collapse
January 30, 2026 – Global cryptocurrency markets experienced significant selling pressure this week, with Solana (SOL) facing particularly severe declines. The asset broke through a crucial support level at $118 that it had maintained for nearly two years, potentially signaling a substantial downward correction. Market analysts now warn that SOL could face a 30% decline if it fails to reclaim this critical technical level in the coming trading sessions.
Solana’s Technical Breakdown and Market Context
The cryptocurrency market entered a broad slump this week, intensifying selling pressure across major digital assets. Solana experienced the most pronounced decline among top cryptocurrencies, losing approximately 6.65% within 24 hours. This decline pushed SOL below the $118 support level that had served as a reliable foundation since March 2024. Historical data shows that SOL had successfully rebounded from this support more than ten times on weekly charts, making the current breakdown particularly significant for technical analysts.
Market participation surged dramatically despite the price decline, with SOL’s trading volume jumping 105% to $7.60 billion during the same period. This substantial volume increase indicates strong interest from traders and investors, leading to heavy market participation during the downturn. The combination of high volume and price decline typically suggests conviction among sellers, potentially signaling further downward momentum.
Institutional Sentiment and Whale Activity Analysis
Institutional investors demonstrated bearish sentiment toward Solana through multiple channels. According to on-chain analytics platform SoSoValue, U.S.-based Solana spot exchange-traded funds (ETFs) recorded significant outflows totaling $2.22 million. These outflows suggest that institutional investors and larger market participants are withdrawing capital from the underlying asset, reflecting growing concerns about Solana’s near-term prospects.
Simultaneously, sophisticated market participants positioned themselves for further declines. Crypto tracker Onchain Lens identified a newly created wallet that deposited 2 million USDC on the Hyperliquid decentralized exchange and opened multiple short positions. Further analysis revealed this entity established a massive SOL short position worth $6.15 million at the $122.91 level. Such substantial bearish positioning by sophisticated traders often precedes continued downward pressure, as these participants typically conduct extensive research before committing significant capital.
The Wall Street Connection and Broader Market Dynamics
The sell-off extended beyond cryptocurrency markets into traditional finance sectors. Wall Street experienced similar downward pressure, suggesting broader macroeconomic factors may be influencing investor behavior across asset classes. This correlation between cryptocurrency and traditional market movements has become increasingly pronounced in recent years as institutional participation in digital assets has grown substantially.
Analysts note that cryptocurrency markets often amplify traditional market movements due to their higher volatility and 24/7 trading nature. The simultaneous pressure across both sectors indicates that fundamental economic concerns, rather than cryptocurrency-specific issues, may be driving the current market sentiment. However, Solana appears particularly vulnerable due to its technical breakdown and concentrated selling pressure from large market participants.
Technical Indicators and Price Projections
Multiple technical indicators support Solana’s bearish outlook following the support breakdown. The asset currently trades below its 50-day Exponential Moving Average (EMA), indicating bearish momentum in the short term. Additionally, the Average Directional Index (ADX), which measures trend strength, has risen to 33 – significantly above the key threshold of 25. This ADX reading suggests SOL is experiencing a strong directional trend, with current momentum favoring downward movement.
Technical analysis of daily price charts indicates that SOL could decline by approximately 30% from current levels, potentially reaching the $78 support zone in coming days. This projection would only validate if the asset remains below or closes a daily candle under the $118 level. The $78 level represents the next major historical support zone, where buying interest might reemerge to stabilize the price.
Key technical levels that traders are monitoring include:
- $112.8: Immediate support level with significant leveraged positions
- $118: Former support now acting as resistance
- $120.2: Upper resistance level with substantial trading interest
- $78: Projected support if 30% decline materializes
Derivatives Market Positioning and Trader Sentiment
Derivatives market data reveals how professional traders are positioning themselves amid Solana’s technical breakdown. According to CoinGlass analytics, intraday traders have established significant leveraged positions around two critical price levels. At the $112.8 support level, traders have positioned for potential breakdowns, while at the $120.2 resistance level, positions anticipate potential rebounds.
The distribution of leveraged positions reveals market tension and uncertainty. Short-leveraged positions total $55.15 million, representing bearish bets on further declines. However, long-leveraged positions are substantially larger at $241 million, indicating that many traders anticipate a rebound despite the technical breakdown. This positioning creates potential for sharp price movements in either direction as these leveraged positions face liquidation pressure.
Derivatives traders typically monitor several key metrics when assessing market conditions:
- Funding rates: Indicate whether longs or shorts are paying premiums
- Open interest: Shows total value of outstanding contracts
- Liquidation levels: Identify price points where positions face automatic closure
- Put/call ratios: Reveal sentiment in options markets
Historical Context and Previous Support Levels
Solana’s current technical situation bears similarities to previous market cycles. The $118 support level had proven remarkably resilient since March 2024, with multiple successful defenses during broader market downturns. This historical resilience makes the current breakdown particularly noteworthy for technical analysts, as levels that withstand repeated tests often become psychologically significant for market participants.
Previous instances where Solana lost major support levels typically resulted in declines of 25-35% before establishing new equilibrium points. The current technical setup suggests a similar magnitude decline could occur if buying interest fails to materialize at current levels. However, cryptocurrency markets have demonstrated capacity for rapid sentiment shifts, meaning technical breakdowns sometimes reverse unexpectedly when broader market conditions improve.
Market Structure and Ecosystem Considerations
Beyond pure price action, Solana’s underlying ecosystem health remains a crucial consideration for long-term investors. The network continues to demonstrate strong fundamentals in several areas, including transaction throughput, developer activity, and decentralized application growth. These fundamental strengths may eventually provide support for the asset’s price, though technical factors currently dominate short-term trading dynamics.
Network activity metrics provide important context for price movements. While this analysis focuses primarily on technical factors and market sentiment, sophisticated investors typically consider both technical and fundamental factors when making allocation decisions. The divergence between strong ecosystem fundamentals and weak price action creates potential opportunities for value-oriented investors, though timing such entries requires careful risk management given current technical deterioration.
Conclusion
Solana faces significant technical challenges after breaking the critical $118 support level that had provided stability since March 2024. Multiple factors contribute to the bearish outlook, including institutional outflows from U.S. spot ETFs, substantial whale short positioning, and deteriorating technical indicators. The convergence of these factors suggests SOL could experience further declines, with technical analysis pointing toward a potential 30% drop to the $78 support zone.
Market participants should monitor whether SOL can reclaim the $118 level in coming trading sessions, as failure to do so would validate the bearish technical projections. While derivatives markets show substantial long positioning anticipating a rebound, the weight of evidence currently favors continued downward pressure. As always in cryptocurrency markets, rapid sentiment shifts can alter technical outlooks quickly, making risk management and position sizing crucial for traders navigating current volatility.
FAQs
Q1: What is the significance of Solana breaking the $118 support level?
The $118 level had served as reliable support since March 2024, with SOL rebounding from this level more than ten times on weekly charts. Breaking this historically significant support suggests weakening buyer interest and potential for further declines.
Q2: How do institutional investors view Solana’s current situation?
Institutional sentiment appears bearish based on U.S. spot ETF outflows totaling $2.22 million. These outflows suggest larger market participants are reducing exposure to SOL amid the technical breakdown and broader market uncertainty.
Q3: What technical indicators support the bearish outlook for SOL?
Multiple indicators suggest bearish momentum, including trading below the 50-day EMA and an ADX reading of 33 (above the 25 threshold indicating strong trend). These technical factors combined with the support breakdown create a concerning picture for short-term price action.
Q4: How are derivatives traders positioning themselves amid Solana’s decline?
Derivatives data shows substantial leveraged positions on both sides, with $55.15 million in short positions and $241 million in long positions. This positioning indicates market tension and potential for sharp moves in either direction as these positions face liquidation pressure.
Q5: What price levels should traders monitor for Solana in coming days?
Key levels include $112.8 (immediate support), $118 (former support now resistance), $120.2 (upper resistance), and $78 (projected support if 30% decline materializes). These levels represent areas of concentrated trading interest and potential price reactions.