Ethereum Price Plummets: Critical $2.8K Support Breach Signals Alarming 22% Downside Risk
Ethereum faces a pivotal moment in global cryptocurrency markets as the second-largest digital asset breaches crucial technical support at $2,800, triggering alarm among traders and analysts who now project potential declines reaching $2,100. This significant breakdown occurred during Thursday’s trading session, marking Ethereum’s first dip below this psychological barrier since early December 2025 and raising fundamental questions about the asset’s near-term trajectory amid broader market weakness.
Ethereum Technical Breakdown: Anatomy of a Support Collapse
The ETH/USD trading pair has demonstrated concerning weakness throughout January 2026, culminating in a decisive break below the $2,800 support level that previously served as a foundation for multiple recovery attempts. Market data reveals Ethereum has declined over 10% during the past three trading sessions alone, accelerating downward momentum that began in mid-January. Technical analysts immediately identified this breach as particularly significant because it coincided with the horizontal boundary of a descending triangle pattern—a classic bearish formation that typically precedes extended declines.
Market observers note that Ethereum now trades around $2,700, a level that prominent analyst Metacryptox describes as a “do or die threshold for bullish sentiment.” The analyst further warns that failure to maintain this level would confirm bearish dominance, potentially opening pathways toward the $2,500 mid-range. This intermediate support aligns precisely with Ethereum’s 200-week simple moving average, a long-term indicator that has historically provided either substantial support or resistance during previous market cycles.
Chart Pattern Convergence and Measured Targets
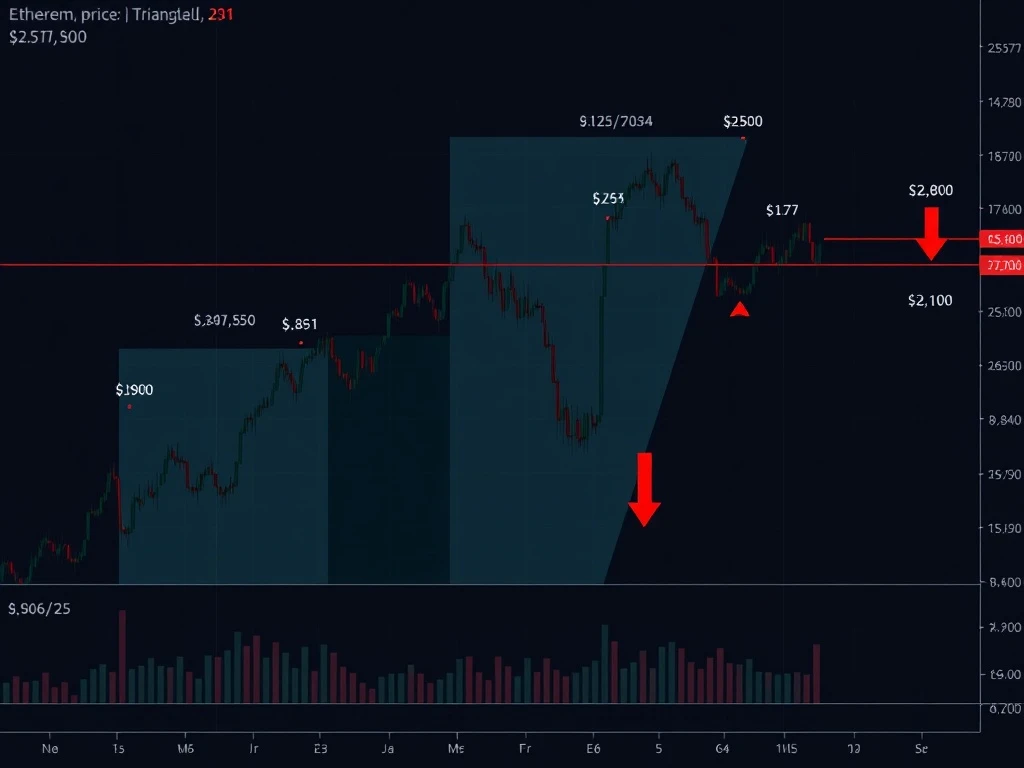
Simultaneously, veteran trader Peter Brandt highlights a separate symmetrical triangle pattern whose lower trendline Ethereum has now violated. Brandt emphasizes that the “burden of proof” has shifted decisively to bulls following this technical breakdown. The measured target calculation for this symmetrical triangle—derived by adding the pattern’s width to the breakout point—projects a decline toward $2,100, representing approximately 22% downside from current price levels.
Technical indicators provide additional confirmation of weakening momentum. The Relative Strength Index (RSI) has dropped precipitously from 68 in early January to 34 currently, establishing a clear bearish divergence as prices make lower lows while momentum indicators fail to confirm these movements. This divergence typically signals underlying weakness that may not be immediately apparent from price action alone.
Onchain Metrics Mirror Previous Bear Market Setups
Beyond traditional chart analysis, blockchain data reveals concerning parallels between current Ethereum market conditions and historical bear cycle initiations. The Net Unrealized Profit/Loss (NUPL) indicator—which measures the difference between relative unrealized profit and loss across all Ethereum holders—has transitioned from the “anxiety” zone (yellow) into the “fear” zone (orange). Historical analysis demonstrates that similar transitions have consistently preceded extended price drawdowns during previous cryptocurrency market cycles.
Glassnode data further reveals that Ethereum’s 111-day moving average has crossed below its 200-day moving average, creating a bearish technical configuration known as a “death cross” among traditional market technicians. Previous instances of this crossover during 2018 and 2022 correlated strongly with the onset of prolonged bear markets, though analysts caution that past performance never guarantees future results in volatile cryptocurrency markets.
Market Context and Broader Implications
The current Ethereum decline occurs within a broader cryptocurrency market correction that has affected numerous digital assets throughout January 2026. Market participants attribute this weakness to several macroeconomic factors including regulatory developments, institutional profit-taking following the 2024-2025 bull market, and shifting monetary policy expectations among global central banks. Ethereum’s particular sensitivity to these factors stems from its dual identity as both a cryptocurrency and a foundational platform for decentralized applications, smart contracts, and the growing decentralized finance ecosystem.
Historical price analysis reveals that the $3,000 to $2,800 range previously constituted a crucial support zone where Ethereum found consistent buying interest throughout late 2025. The definitive loss of this zone has therefore triggered automated selling from algorithmic trading systems and stop-loss orders, potentially exacerbating downward pressure. Market depth data suggests limited buy-side liquidity exists between current levels and the $2,500 support zone, increasing the likelihood of rapid declines if selling pressure intensifies.
Expert Perspectives and Market Sentiment Analysis
Financial analysts emphasize that while technical patterns suggest significant downside risk, cryptocurrency markets remain notoriously unpredictable. The projected $2,100 target represents a confluence point where both the descending triangle and symmetrical triangle patterns complete their measured moves. However, markets frequently overshoot or undershoot such technical targets, particularly during periods of heightened volatility.
Seasoned traders note that Ethereum has demonstrated remarkable resilience throughout its history, recovering from numerous corrections exceeding 50% during previous market cycles. The current 22% projected decline, while substantial, remains within historical norms for Ethereum corrections during non-bull market periods. Furthermore, fundamental developments including Ethereum’s ongoing protocol upgrades, growing adoption in institutional portfolios, and expanding use cases within decentralized finance and non-fungible token ecosystems may provide countervailing support that technical analysis cannot fully capture.
Risk Management Considerations for Market Participants
Professional traders emphasize several risk management strategies during periods of technical breakdown. These include position sizing adjustments, implementing stop-loss orders below key support levels, and maintaining balanced portfolio allocations across different asset classes. Historical volatility analysis suggests Ethereum may experience increased price swings during the coming weeks as the market searches for a new equilibrium following the $2,800 support breach.
Market structure analysis reveals that significant support clusters exist at several price levels below current trading ranges:
- $2,500: Convergence of 200-week moving average and psychological round number
- $2,300: Previous resistance-turned-support from Q3 2025
- $2,100: Technical pattern targets and 61.8% Fibonacci retracement level
- $1,800: Major support zone from 2024 accumulation period
These levels may provide potential stabilization points if downward momentum continues, though their effectiveness depends on broader market conditions and fundamental developments.
Conclusion
Ethereum confronts a critical technical juncture following its decisive break below the $2,800 support level, with chart patterns and onchain metrics converging to suggest potential declines toward $2,100. While technical analysis provides a framework for understanding market structure, cryptocurrency prices ultimately respond to complex interactions between fundamental developments, macroeconomic conditions, and shifting investor sentiment. Market participants should monitor upcoming Ethereum network upgrades, regulatory developments, and broader financial market trends while maintaining appropriate risk management protocols during this period of elevated volatility and technical uncertainty.
FAQs
Q1: What caused Ethereum to break below $2,800?
Ethereum’s decline below $2,800 resulted from converging factors including broader cryptocurrency market weakness, technical pattern breakdowns, and shifting onchain metrics. The breach coincided with the horizontal support line of a descending triangle pattern, triggering automated selling and stop-loss orders.
Q2: How reliable are the chart patterns predicting $2,100?
Technical patterns provide probability-based projections rather than certain predictions. The $2,100 target represents a confluence point where multiple chart patterns complete their measured moves, but markets frequently deviate from such projections based on fundamental developments and changing market conditions.
Q3: What is the Net Unrealized Profit/Loss indicator signaling?
The NUPL indicator has transitioned into the “fear” zone, suggesting that a higher proportion of Ethereum holders are experiencing unrealized losses. Historically, similar transitions have correlated with extended price declines, though the indicator functions as a sentiment measure rather than a direct price predictor.
Q4: How does this decline compare to previous Ethereum corrections?
The projected 22% decline from current levels remains within historical norms for Ethereum corrections. During previous bear markets, Ethereum has experienced drawdowns exceeding 50% on multiple occasions, though past performance never guarantees future results in cryptocurrency markets.
Q5: What support levels exist below current prices?
Significant technical support clusters exist at $2,500 (200-week moving average), $2,300 (previous resistance), $2,100 (pattern targets), and $1,800 (2024 accumulation zone). These levels may provide potential stabilization points during continued declines.