VIRTUAL Protocol Targets $1.33: The Critical Level Every Trader Must Monitor Now
As the broader cryptocurrency market experiences heightened volatility in January 2026, VIRTUAL Protocol (VIRTUAL) presents a compelling technical case that demands trader attention. The token, operating within the competitive crypto AI sector, recently demonstrated significant price action that established crucial market structure changes. Following a substantial rally in early January that pushed VIRTUAL to $1.19, the subsequent retracement has created what technical analysts identify as a potential buying opportunity, with the $0.758 level emerging as the critical threshold for maintaining bullish momentum toward the $1.33 target.
VIRTUAL Protocol’s Market Context and Sector Performance
The crypto AI sector has faced considerable pressure throughout January 2026, according to comprehensive data from CoinMarketCap. Most leading tokens within this innovative category registered double-digit percentage losses over the past week, reflecting broader market sentiment shifts. Artificial Superintelligence Alliance (FET) recorded a 16.84% decline, while Story (IP) showed relative resilience with a 7.53% decrease. VIRTUAL Protocol mirrored this sector trend with a 15.71% weekly decline, yet this movement occurred within a specific technical context that distinguishes it from pure bearish deterioration.
Market analysts emphasize that sector-wide corrections often create differentiation opportunities among fundamentally sound projects. The crypto AI sector, which leverages blockchain technology to power decentralized artificial intelligence applications, has attracted substantial institutional and retail interest since its emergence. These tokens typically demonstrate higher volatility during market transitions, making precise technical analysis particularly valuable for risk management.
The Technical Structure Shift: January’s Bullish Breakout
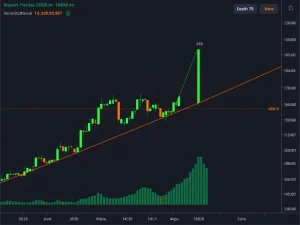
VIRTUAL Protocol’s price action during the first week of January 2026 established what technical analysts describe as a structural shift. The token successfully broke through two significant swing levels at $0.73 and $1.05, which previously served as resistance during a multi-month downtrend. This breakout represented genuine bullish intent according to classical technical analysis principles, as it occurred with substantial volume and momentum.
Following this upward movement, the inevitable retracement brought VIRTUAL back toward the $0.75-$0.76 area, which analysts had previously identified as a key demand zone. This retracement depth, while appearing concerning on surface examination, actually aligns with healthy market behavior following strong upward movements. The 78.6% Fibonacci retracement level at $0.758 specifically serves as the critical technical threshold that traders must monitor for maintaining the bullish bias established in early January.
Technical Indicators and Moving Average Analysis
The daily timeframe chart reveals several important technical developments that inform current trading decisions. First, VIRTUAL’s price has descended below both the 20-day and 50-day simple moving averages (SMAs), typically indicating short-term bearish momentum. However, context matters significantly in technical analysis. The positioning relative to these moving averages must be considered alongside the broader market structure established by the January breakout.
Second, the Chaikin Money Flow (CMF) indicator has moved below -0.05, signaling substantial capital outflow from VIRTUAL markets. This metric, which combines price and volume to measure buying and selling pressure, suggests that sellers have dominated recent sessions. Despite this bearish signal, experienced analysts note that CMF readings often reach extreme levels near potential reversal points, particularly when price approaches historically significant support zones.
Key Technical Levels for VIRTUAL Protocol:
- Critical Support: $0.758 (78.6% Fibonacci retracement)
- Immediate Resistance: $0.88 (recent range high)
- Primary Target: $1.19 (January swing high)
- Extended Target: $1.33 (measured move projection)
- Major Support Zone: $0.73-$0.76 (historical demand area)
Exchange Flow Dynamics and Market Sentiment
Beyond pure price analysis, on-chain metrics provide crucial context for understanding market participant behavior. Exchange netflow data, which tracks the movement of tokens to and from cryptocurrency exchanges, reveals a predominantly positive trend over the past six months for VIRTUAL Protocol. The 7-day moving average of exchange flows shows consistent deposits to trading platforms, with only brief periods of outflow occurring in August and November 2025, and more recently in January 2026.
This pattern typically indicates that token holders continue sending VIRTUAL to exchanges, potentially for selling purposes. Such behavior suggests a lack of strong conviction among some market participants, creating headwinds for immediate price appreciation. However, sophisticated analysts interpret this data alongside price action, noting that sustained selling pressure during a retracement to support often exhausts weak hands and sets the stage for renewed upward movement when buyers eventually absorb the available supply.
Short-Term Range Development and Trading Implications
Over the past week, VIRTUAL Protocol has established a relatively tight trading range between $0.80 and $0.88. This consolidation pattern following the deeper retracement suggests that selling pressure may be diminishing as the price approaches the critical $0.758 support level. For lower timeframe traders, this range provides clear parameters for risk management, with breakdowns below $0.80 signaling potential acceleration toward the key support, while breaks above $0.88 indicating near-term bullish momentum returning.
Traders implementing multiple timeframe analysis often monitor such ranges for confluence with higher timeframe levels. The proximity of this short-term range to the major $0.758 support creates a zone of heightened technical significance where market direction decisions frequently occur. Volume analysis within this range becomes particularly important, as increasing volume on upward movements suggests genuine buying interest, while low-volume rallies often precede further declines.
Comparative Sector Analysis and Broader Market Impact
The performance of VIRTUAL Protocol cannot be fully understood without examining its position within the crypto AI sector and the broader digital asset market. This sector has demonstrated both higher volatility and stronger growth potential than many cryptocurrency categories throughout 2025 and into 2026, attracting substantial development activity and venture capital investment. The fundamental premise of combining artificial intelligence with blockchain technology continues to generate significant interest despite periodic market corrections.
When comparing VIRTUAL’s technical structure to sector peers, several distinctions emerge. While most crypto AI tokens experienced similar percentage declines recently, the specific technical patterns and support levels vary considerably. This differentiation highlights the importance of project-specific analysis rather than relying solely on sector generalizations. VIRTUAL’s established demand zone around $0.75 and its clear January breakout provide more defined technical parameters than many comparable tokens currently offer traders.
Crypto AI Sector Weekly Performance (January 2026):
- Artificial Superintelligence Alliance (FET): -16.84%
- Story (IP): -7.53%
- VIRTUAL Protocol (VIRTUAL): -15.71%
- Sector Average: -13.36% (excluding outliers)
Risk Management Considerations for Traders
Successful trading in volatile cryptocurrency markets requires disciplined risk management alongside technical analysis. For VIRTUAL Protocol, the clear technical levels provide natural points for implementing risk controls. The $0.758 support serves as the logical invalidation point for bullish swing trades based on the January breakout thesis. A sustained break below this level, particularly on increasing volume and with confirmation from momentum indicators, would signal that the bullish structure has deteriorated.
Conversely, traders maintaining bullish positions should monitor price action as VIRTUAL approaches the $1.19 resistance level, which represents the January swing high. This level will likely generate selling pressure as earlier buyers seek to exit positions at breakeven or with minimal profits. How price reacts at this resistance will provide valuable information about whether the move toward $1.33 remains viable or if further consolidation becomes necessary before continued upward movement.
The Fundamental Backdrop: AI and Blockchain Convergence
While this analysis focuses primarily on technical factors, the fundamental context surrounding VIRTUAL Protocol and the crypto AI sector merits consideration. The convergence of artificial intelligence and blockchain technology represents one of the most significant technological developments of the mid-2020s. Projects that successfully implement decentralized AI solutions stand to benefit from substantial network effects and adoption tailwinds as these technologies mature.
VIRTUAL Protocol specifically aims to facilitate virtual environments and AI interactions through blockchain infrastructure. The project’s development progress, partnership announcements, and protocol upgrades throughout 2025 have contributed to its growing recognition within the sector. Fundamental developments of this nature often eventually translate to price appreciation, though the timing remains uncertain and subject to broader market conditions.
Conclusion
VIRTUAL Protocol presents a technically defined trading scenario as of January 2026, with the $0.758 level serving as the critical threshold for maintaining the bullish structure established during early January’s breakout. While recent price action and exchange flow metrics suggest near-term bearish pressure, the broader technical context indicates this retracement may represent a buying opportunity for traders targeting the $1.19 and $1.33 levels. The token’s performance within the volatile crypto AI sector requires careful monitoring of both project-specific technical levels and broader market sentiment. As always, traders should implement appropriate risk management strategies and consider multiple timeframe analysis when making trading decisions in rapidly evolving cryptocurrency markets.
FAQs
Q1: What is the most important price level for VIRTUAL Protocol according to technical analysis?
The $0.758 level represents the critical technical threshold, corresponding to the 78.6% Fibonacci retracement of the January rally. Maintaining this support is essential for the bullish structure to remain valid.
Q2: Why did VIRTUAL Protocol decline despite the January breakout?
Retracements following strong upward movements represent normal market behavior as traders take profits and the price seeks equilibrium. The 15.71% weekly decline aligns with broader sector weakness while testing important historical support levels.
Q3: How does exchange flow data impact VIRTUAL’s price outlook?
Predominantly positive exchange netflows suggest ongoing selling pressure as tokens move to exchanges. However, this metric must be considered alongside price action at technical support levels, where such selling often becomes exhausted.
Q4: What are the primary price targets if VIRTUAL maintains its bullish structure?
The immediate target is a retest of the January swing high at $1.19, followed by a measured move projection toward $1.33. These targets derive from the breakout magnitude and Fibonacci extension levels.
Q5: How does VIRTUAL’s performance compare to other crypto AI tokens?
VIRTUAL’s 15.71% weekly decline places it slightly below the sector average of approximately 13.36%, though its technical structure appears more defined with clearer support and resistance levels than many peers.