Crypto Fear & Greed Index Stubbornly Stuck at 25: Why Extreme Fear Grips Digital Asset Markets
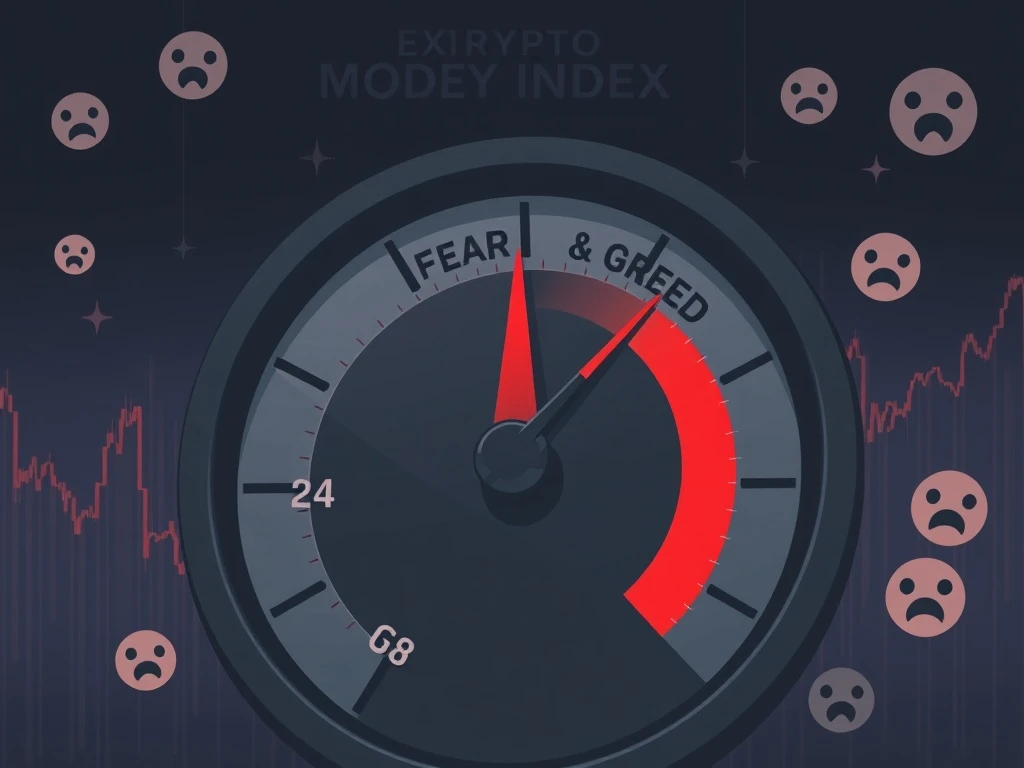
Global cryptocurrency markets continue to exhibit extreme fear sentiment as the widely watched Crypto Fear & Greed Index registers a concerning 25 points this week. This persistent negative reading marks one of the longest stretches of bearish investor psychology since the 2022 market downturn. Market analysts note the index’s stubborn refusal to climb above the extreme fear threshold despite recent technical rebounds in major digital assets.
Understanding the Crypto Fear & Greed Index Mechanics
The Crypto Fear & Greed Index serves as a crucial barometer for digital asset market psychology. Developed by data provider Alternative, this quantitative tool measures sentiment across six weighted components. Market volatility contributes 25% to the final score, while trading volume accounts for another 25%. Social media sentiment analysis represents 15% of the calculation, matching the weight given to direct investor surveys. Bitcoin’s market dominance contributes 10%, and Google search trends for cryptocurrency terms complete the remaining 10% weighting.
This multi-factor approach creates a robust framework that captures both market behavior and public interest. The index operates on a scale from 0 to 100, where 0 represents maximum fear and 100 indicates extreme greed. Readings below 25 consistently fall into the extreme fear category, suggesting widespread investor anxiety and risk aversion. Historical data reveals that prolonged periods below 30 often precede significant market inflection points.
The Six Components of Market Sentiment
Each component of the index provides unique insights into market dynamics. Volatility measurements track price fluctuations across major cryptocurrencies, with higher volatility typically correlating with fear. Trading volume analysis distinguishes between organic market activity and potential manipulation. Social media monitoring captures real-time sentiment across platforms like Twitter and Reddit. Direct surveys provide controlled data from active traders and investors. Bitcoin dominance indicates capital rotation patterns, while Google search volume reflects mainstream interest levels.
Historical Context of Extreme Fear Readings
The current extreme fear reading represents a continuation of negative sentiment that began in early 2024. Historical analysis reveals several patterns associated with prolonged fear periods. During the 2018-2019 bear market, the index spent 47 consecutive weeks in extreme fear territory. Similarly, the 2022 market correction saw 39 weeks of extreme fear readings. The current streak of 15 weeks suggests markets may be approaching a potential sentiment extreme.
Comparative data shows interesting relationships between index readings and subsequent market movements. For instance, the index reached single-digit readings during March 2020’s pandemic-induced crash, which preceded a historic bull run. Conversely, extreme greed readings above 90 in late 2021 accurately predicted the subsequent market correction. This pattern recognition helps investors understand potential turning points in market cycles.
| Date | Index Reading | Market Condition | Subsequent 90-Day BTC Performance |
|---|---|---|---|
| March 2020 | 8 | Extreme Fear | +150% |
| November 2021 | 94 | Extreme Greed | -45% |
| June 2022 | 11 | Extreme Fear | +22% |
| Current Reading | 25 | Extreme Fear | To be determined |
Current Market Factors Contributing to Fear
Several macroeconomic and cryptocurrency-specific factors maintain current fear levels. Regulatory uncertainty continues to impact investor confidence across major jurisdictions. The ongoing implementation of comprehensive crypto frameworks in Europe contrasts with more fragmented approaches in the United States. Additionally, traditional financial market volatility influences digital asset sentiment through correlation effects that have strengthened in recent years.
Technical market factors also contribute significantly to the fear reading. Bitcoin’s failure to maintain support above key psychological levels has increased volatility measurements. Trading volume patterns show reduced institutional participation compared to previous quarters. Social media analysis reveals heightened concern about exchange stability and custody solutions. These combined factors create a self-reinforcing cycle of caution among market participants.
Expert Analysis of Sentiment Indicators
Market analysts emphasize the importance of contextualizing fear readings. “The Fear & Greed Index provides valuable contrarian signals,” explains Dr. Elena Rodriguez, behavioral finance researcher at Cambridge Digital Assets Programme. “Historically, extreme fear periods have presented accumulation opportunities for patient investors. However, current readings must be considered alongside fundamental factors including adoption metrics and regulatory developments.”
Technical analysts note specific patterns in the current market structure. “We’re observing classic capitulation signals across multiple timeframes,” states Michael Chen, chief technical analyst at Blockchain Insights Group. “The combination of extreme fear readings with oversold technical indicators suggests we may be approaching a sentiment exhaustion point. However, confirmation requires sustained improvement in volume and volatility metrics.”
Impact on Different Market Participants
Extreme fear conditions affect various market participants differently. Retail investors typically exhibit heightened sensitivity to fear readings, often reducing positions or delaying new investments. Institutional investors frequently use sentiment extremes to execute accumulation strategies during periods of reduced competition. Miners and validators face different considerations, as prolonged fear periods can impact network security and operational economics.
The current environment presents specific challenges and opportunities:
- Long-term holders often increase accumulation during fear periods
- Active traders face increased volatility and reduced liquidity
- Project developers may experience funding challenges
- Exchange platforms typically see reduced trading volumes
- Regulators monitor market stability during extreme sentiment periods
Comparative Analysis with Traditional Fear Indicators
The cryptocurrency Fear & Greed Index parallels similar indicators in traditional finance. The VIX volatility index, often called the “fear gauge” for stock markets, serves a comparable function for equities. However, important differences exist in calculation methodologies and market structures. Cryptocurrency markets operate continuously, while traditional markets have defined trading hours. Additionally, cryptocurrency sentiment incorporates more social media data than traditional indicators.
Recent correlation studies show increasing alignment between cryptocurrency and traditional market sentiment during stress periods. This convergence reflects cryptocurrency’s maturation as an asset class and growing institutional participation. However, cryptocurrency markets still exhibit higher sensitivity to sentiment shifts due to structural factors including lower market capitalization and different participant demographics.
Conclusion
The Crypto Fear & Greed Index reading of 25 confirms continued extreme fear conditions across digital asset markets. This persistent negative sentiment reflects ongoing concerns about regulatory frameworks, macroeconomic conditions, and technical market factors. Historical analysis suggests that prolonged fear periods often precede significant market movements, though timing remains unpredictable. Investors should monitor multiple indicators beyond sentiment alone, including fundamental adoption metrics and technical market structure. The current extreme fear reading provides valuable context for market positioning but should be considered alongside comprehensive fundamental and technical analysis.
FAQs
Q1: What does a Crypto Fear & Greed Index reading of 25 mean?
The reading of 25 indicates extreme fear conditions in cryptocurrency markets. This suggests widespread investor anxiety, risk aversion, and negative sentiment across multiple market indicators including volatility, volume, and social media discussion.
Q2: How often does the Crypto Fear & Greed Index update?
The index updates daily, incorporating the most recent available data across all six components. Some components like social media sentiment update in near real-time, while others like survey data may have slightly longer collection periods.
Q3: Has the index ever been lower than 25?
Yes, the index has reached much lower readings during previous market crises. The all-time low of 8 occurred during March 2020’s pandemic-induced market crash. Other significant lows include 11 in June 2022 and various readings in the teens during the 2018 bear market.
Q4: How accurate is the Fear & Greed Index in predicting market turns?
The index serves as a sentiment indicator rather than a predictive tool. Extreme readings often coincide with market inflection points, but correlation doesn’t guarantee causation. Investors should use the index alongside other fundamental and technical analysis tools.
Q5: Can the Fear & Greed Index be manipulated?
The multi-factor design makes manipulation difficult but not impossible. The inclusion of six different components with varying weights reduces the impact of any single manipulated metric. However, coordinated social media campaigns or trading activity could theoretically influence certain components temporarily.