Altcoin Season Index Plummets to 30: A Critical Signal for Cryptocurrency Investors
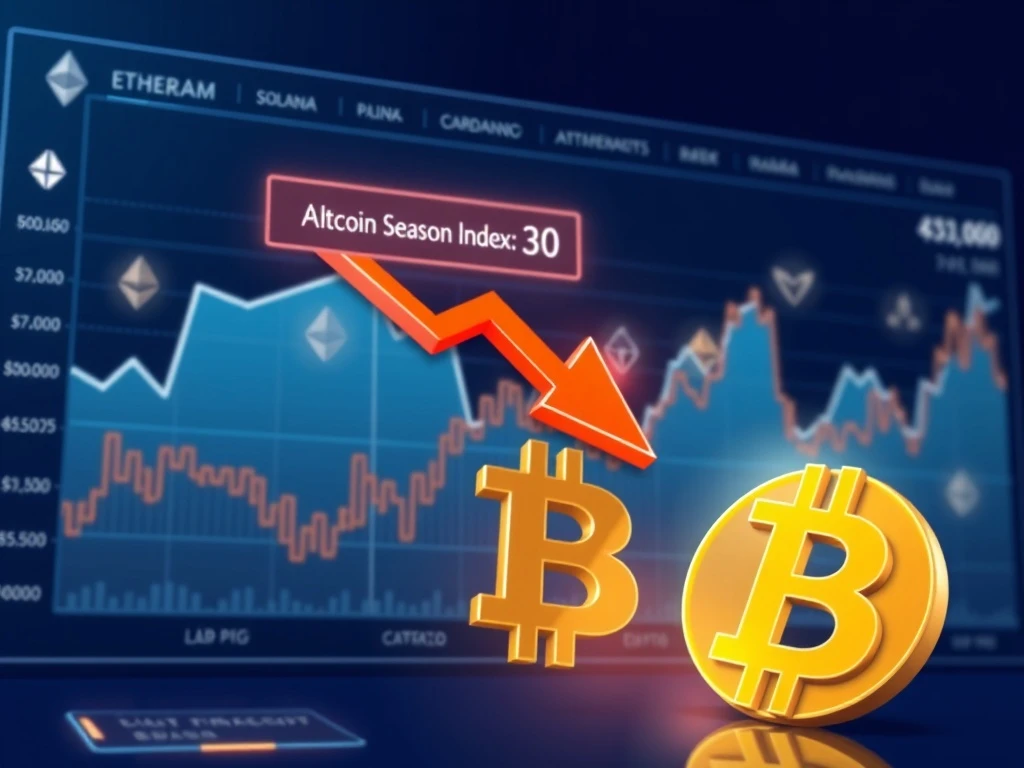
Global cryptocurrency markets are flashing a significant signal as CoinMarketCap’s closely watched Altcoin Season Index has declined to a reading of 30, marking a two-point drop from the previous day and suggesting a potential retreat from altcoin dominance. This pivotal metric, which gauges the relative strength of alternative cryptocurrencies against Bitcoin, now sits far from the 75 threshold required to declare a formal ‘altcoin season,’ prompting analysis from traders and analysts worldwide. The shift indicates that Bitcoin may be reasserting its leadership role in the digital asset ecosystem, a dynamic with profound implications for portfolio strategy and market sentiment.
Understanding the Altcoin Season Index Drop
CoinMarketCap’s Altcoin Season Index serves as a crucial barometer for market cycles. The index operates on a straightforward but powerful premise: it compares the 90-day performance of the top 100 cryptocurrencies by market capitalization—excluding stablecoins and wrapped tokens—against Bitcoin’s performance over the same period. A formal altcoin season is declared only if 75% of these assets outperform Bitcoin. Consequently, a reading of 30 signifies that a minority of major altcoins are currently beating the benchmark set by the original cryptocurrency. This decline from 32 to 30, while seemingly small, continues a broader trend observed in recent weeks, reflecting a measurable shift in capital flows and investor preference.
Historically, the cryptocurrency market moves in distinct phases. Bitcoin often leads major bull markets, with capital subsequently rotating into altcoins as investors seek higher returns—a period marked by a rising Altcoin Season Index. Conversely, when risk appetite wanes or macroeconomic uncertainty increases, capital frequently flows back into Bitcoin, perceived as a more established store of value within the digital asset space. The current index level of 30 strongly suggests we are in the latter phase. Market data from the past month shows Bitcoin’s dominance—its share of the total cryptocurrency market capitalization—has steadily increased, correlating directly with the falling Altcoin Season Index.
The Mechanics Behind the Metric
The calculation methodology ensures the index reflects genuine performance rather than hype. By excluding stablecoins, which are designed to maintain a fixed price, and wrapped tokens, which simply represent another asset on a different blockchain, the index focuses purely on volatile, speculative assets competing for investor attention. Analysts at firms like Arcane Research and Glassnode often cross-reference this data with on-chain metrics, such as exchange flows and wallet activity, to confirm trends. The 90-day window is particularly insightful; it smooths out short-term volatility and captures sustained trends, making a reading of 30 a meaningful signal of a prolonged period of altcoin underperformance relative to Bitcoin.
Historical Context and Market Cycle Implications
Examining the historical trajectory of the Altcoin Season Index provides essential context for the current reading of 30. During the peak of the 2021 bull market, the index repeatedly surged above 75, with some periods seeing readings near 100. Those phases were characterized by explosive, often parabolic, gains in altcoins across decentralized finance (DeFi), non-fungible tokens (NFTs), and layer-1 blockchain platforms. However, the index’s journey back down has been just as telling. Prolonged periods below 50, like the current one, have typically coincided with bear markets or consolidation phases where Bitcoin acts as a relative safe haven.
The table below illustrates key historical thresholds of the index and their typical market implications:
| Index Range | Market Phase Interpretation | Common Investor Behavior |
|---|---|---|
| 75 – 100 | Active Altcoin Season | Aggressive altcoin accumulation, high risk appetite |
| 50 – 74 | Neutral/Balanced Market | Diversified portfolios, cautious altcoin investment |
| 25 – 49 | Bitcoin Dominance Phase | Capital rotation into Bitcoin, reduced altcoin exposure |
| 0 – 24 | Strong Bitcoin Leadership | Defensive positioning, minimal altcoin speculation |
This historical pattern suggests the current index level of 30 places the market firmly in a ‘Bitcoin Dominance Phase.’ Such phases are not necessarily negative for the overall ecosystem; they often represent periods of consolidation, where weaker projects fail and fundamental value is reassessed, laying the groundwork for the next cycle of innovation. For instance, the prolonged period of Bitcoin dominance in 2019 preceded the DeFi summer of 2020.
Expert Analysis on the Current Crypto Climate
Market analysts emphasize that a low Altcoin Season Index reading does not spell doom for all alternative cryptocurrencies. Instead, it signals a shift towards selectivity and fundamentals. ‘An index at 30 tells us the market is discriminating,’ notes a veteran crypto strategist from a major trading firm. ‘It’s no longer a rising tide lifting all boats. Investors are meticulously differentiating between projects with robust use cases, active development, and sustainable tokenomics versus those driven purely by speculation. This is a healthy, albeit painful, maturation process for the asset class.’
Several concurrent factors are contributing to this environment:
- Macroeconomic Pressure: Rising interest rates and inflation concerns in traditional finance have increased risk aversion, impacting high-beta assets like altcoins more severely than Bitcoin.
- Regulatory Scrutiny: Increased regulatory clarity—or uncertainty—around the classification of digital assets often affects altcoin projects more immediately than Bitcoin.
- Network Activity Divergence: On-chain data reveals that while Bitcoin’s network activity remains stable or grows, activity on some altcoin networks has plateaued or declined, reflecting reduced utility demand.
- Liquidity Dynamics: Market liquidity tends to concentrate in Bitcoin during uncertain times, as it maintains the deepest order books and highest trading volumes across global exchanges.
This expert perspective underscores that the index is a symptom of broader market forces, not a cause. The reading of 30 is a composite reflection of investor psychology, macroeconomic conditions, and the intrinsic development progress across hundreds of blockchain projects.
Strategic Implications for Cryptocurrency Portfolios
For investors and portfolio managers, the Altcoin Season Index provides a valuable, data-driven input for strategic allocation. A reading of 30 advocates for a cautious and measured approach to altcoin exposure. Common strategies employed during such phases include increasing the core Bitcoin allocation, focusing on altcoins with the strongest fundamentals and clearest paths to adoption, and employing stricter risk management protocols like tighter stop-loss orders. Furthermore, this period is often used for deep due diligence and research into emerging sectors, such as zero-knowledge proofs or decentralized physical infrastructure networks (DePIN), in preparation for the next market rotation.
It is also critical to monitor leading indicators that might foreshadow a reversal in the index. Analysts watch for:
- A sustained breakout in Bitcoin dominance above a key resistance level, which could extend the altcoin winter.
- Divergences where the index stabilizes or ticks up slightly while Bitcoin dominance continues to rise, potentially signaling early accumulation in select altcoins.
- Major catalyst events for specific altcoin sectors, like a successful major protocol upgrade or a landmark regulatory decision, which could spark localized rallies independent of the broader index trend.
The current landscape demands patience and discipline. The index does not predict immediate price movements but indicates the prevailing market regime. Navigating a regime of Bitcoin dominance successfully requires a different mindset than navigating an active altcoin season.
Conclusion
The Altcoin Season Index’s decline to 30 offers a clear, quantitative snapshot of the current cryptocurrency market structure, highlighting a pronounced phase of Bitcoin dominance. This shift, rooted in comparative 90-day performance data, reflects broader macroeconomic headwinds, evolving regulatory landscapes, and a natural maturation within the crypto asset cycle. While distant from the 75 threshold needed for an ‘altcoin season,’ this reading presents a period for strategic portfolio reassessment, fundamental research, and disciplined risk management. Historically, such phases have served as necessary consolidation periods, separating transient trends from projects with enduring value. Monitoring this Altcoin Season Index, alongside on-chain data and macroeconomic indicators, remains essential for understanding the complex rhythms of the digital asset market.
FAQs
Q1: What does an Altcoin Season Index of 30 mean?
An index reading of 30 means that only a minority of the top 100 cryptocurrencies (excluding stablecoins) have outperformed Bitcoin over the past 90 days. It indicates the market is in a phase dominated by Bitcoin’s relative strength, far from the ‘altcoin season’ threshold of 75.
Q2: How is the Altcoin Season Index calculated?
CoinMarketCap calculates the index by comparing the 90-day price performance of each of the top 100 cryptocurrencies by market cap against Bitcoin’s performance over the same period. The index reflects the percentage of those altcoins that have outperformed Bitcoin.
Q3: Should I sell all my altcoins if the index is low?
Not necessarily. A low index suggests a period of caution and selectivity, not a blanket sell signal. It may be a time to rebalance towards higher-quality projects with strong fundamentals, increase Bitcoin exposure, and employ stricter risk management, rather than exiting the altcoin market entirely.
Q4: How often does the Altcoin Season Index update?
The index updates daily, reflecting the latest 90-day rolling performance data. This allows investors and analysts to track gradual shifts in market momentum and relative strength between Bitcoin and altcoins.
Q5: Can the index predict the bottom or top of the market?
The index is not a precise timing tool for market tops or bottoms. It is a regime indicator. Extremely high readings (near 100) can signal overheated altcoin markets, while very low readings (below 25) can indicate maximum pessimism toward altcoins, which sometimes precedes a turnaround. It is best used in conjunction with other on-chain and technical indicators.