Solana’s Stunning Staking Surge: How 70% Locked Supply Creates Economic Dominance Over Ethereum

January 22, 2026 – Global cryptocurrency markets face significant volatility as macroeconomic uncertainty tests investor conviction. Amid this turbulence, fundamental blockchain metrics reveal a compelling divergence between two leading Layer-1 networks. Solana demonstrates remarkable economic strength through unprecedented staking participation, potentially reshaping the competitive landscape against Ethereum.
Solana’s Staking Milestone: Unprecedented Token Lockup
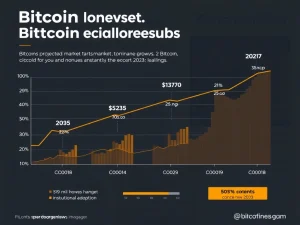
According to comprehensive data from Token Terminal, Solana’s staking ratio reached a historic 70% threshold this week. This development represents a significant milestone for the network’s economic security. Approximately $60 billion worth of SOL tokens now participate in network validation through staking mechanisms. Consequently, this high participation rate creates substantial supply constraints within the circulating token economy.
Ethereum maintains strong staking participation simultaneously. BitMine continues expanding its institutional staking position, adding 86,000 ETH to validation pools recently. Ethereum’s staking ratio consequently reached its own all-time high of 30%, representing approximately $120 billion in locked value. Both networks demonstrate growing validator commitment despite broader market uncertainty.
Economic Implications of Divergent Staking Ratios
The substantial difference between 70% and 30% staking ratios carries significant economic implications. Solana’s approach creates dramatically different supply dynamics compared to Ethereum’s model. With 567 million SOL tokens currently circulating, the 70% staking ratio effectively removes nearly 400 million tokens from active trading markets. This reduction creates potential supply scarcity that could influence price discovery mechanisms.
Supply Constraint Analysis
Comparative analysis reveals striking differences in absolute staked amounts. Solana currently maintains approximately 10 times more staked tokens than Ethereum in numerical terms. This divergence highlights fundamentally different economic models between the two blockchain networks. Supply-demand imbalances typically drive significant price movements in cryptocurrency markets. Therefore, Solana’s higher staking percentage suggests potentially stronger supply-side economics during periods of increasing demand.
Market data supports this economic analysis. The SOL/ETH trading ratio increased 2.13% recently despite broader market volatility. This relative strength indicates growing market recognition of Solana’s improving fundamentals. Additionally, cross-chain capital flows show substantial movement from Ethereum to Solana networks. Over $50 million bridged between the networks during the past seven days alone, representing more than 50% of total bridged capital.
Network Fundamentals and Long-Term Implications
Staking ratios serve as crucial indicators of long-term network conviction. Higher staking percentages generally correlate with stronger validator commitment to network security and governance. Solana’s 70% staking ratio suggests exceptionally strong validator confidence in the network’s future development trajectory. This confidence potentially translates into more stable network operations and reduced selling pressure from validators.
Ethereum’s staking approach differs fundamentally in design philosophy. The network maintains different economic security assumptions and validator requirements. However, both networks achieve record staking participation simultaneously, indicating broader industry trends toward proof-of-stake security models. This parallel growth demonstrates maturing validator ecosystems across major blockchain networks.
Technical Strength Indicators
Beyond staking metrics, multiple technical indicators support Solana’s growing network momentum. On-chain activity metrics show increasing transaction volumes and decentralized application usage. Network upgrades continue improving throughput capabilities and reducing transaction costs. These improvements contribute to Solana’s competitive positioning against Ethereum’s established ecosystem.
Market analysts observe that staking economics increasingly influence investor decision-making processes. The relationship between staked supply and circulating supply creates measurable impacts on token volatility and liquidity characteristics. Networks with higher staking ratios typically demonstrate reduced circulating supply, potentially amplifying price movements during periods of sustained demand.
Comparative Staking Economics Table
| Metric | Solana (SOL) | Ethereum (ETH) |
|---|---|---|
| Staking Ratio | 70% | 30% |
| Staked Value | $60 Billion | $120 Billion |
| Circulating Supply | 567 Million | ~120 Million |
| Staked Tokens | ~400 Million | ~37 Million |
| Supply Reduction | Significant | Moderate |
Market Context and Future Trajectories
Current market conditions emphasize the importance of fundamental network strength. Macroeconomic uncertainty creates challenging environments for risk assets generally. Cryptocurrency markets experience capital rotation and volatility as investors reassess risk exposures. In this context, networks demonstrating strong fundamentals potentially maintain relative strength during market turbulence.
Solana’s staking achievements occur alongside broader ecosystem development. The network continues attracting developer talent and application deployment. These factors combine to create positive network effects that reinforce Solana’s competitive position. Meanwhile, Ethereum maintains its dominant position in decentralized finance and institutional adoption, creating a complex competitive dynamic between the two networks.
Expert Perspectives on Staking Significance
Industry analysts emphasize that staking ratios represent just one dimension of network health. Comprehensive evaluation requires examining multiple factors including developer activity, application diversity, and security robustness. However, staking metrics provide valuable insights into economic security and validator confidence. These factors increasingly influence institutional investment decisions and long-term network viability assessments.
The divergence between Solana and Ethereum staking approaches reflects different philosophical foundations. Solana prioritizes high throughput and low transaction costs, while Ethereum emphasizes decentralization and security through different mechanisms. These philosophical differences manifest in varying economic models and staking implementations.
Conclusion
Solana demonstrates remarkable economic strength through its unprecedented 70% staking ratio, creating substantially different supply dynamics compared to Ethereum. This development highlights evolving competitive dynamics between leading Layer-1 blockchain networks. While both networks achieve record staking participation, Solana’s higher percentage creates potentially stronger supply-side economics. Market indicators including the SOL/ETH ratio and cross-chain capital flows support this fundamental analysis. Ultimately, staking metrics provide crucial insights into network health and long-term viability as cryptocurrency markets mature.
FAQs
Q1: What does staking ratio measure in blockchain networks?
Staking ratio measures the percentage of circulating tokens actively participating in network validation through proof-of-stake mechanisms. This metric indicates validator commitment and economic security.
Q2: Why does Solana have a higher staking ratio than Ethereum?
Solana’s architecture and economic model encourage higher staking participation through different incentive structures and technical requirements compared to Ethereum’s staking implementation.
Q3: How does staking affect cryptocurrency prices?
Higher staking ratios reduce circulating supply, potentially creating supply scarcity that amplifies price movements during periods of increasing demand, though multiple factors influence prices.
Q4: Can staking ratios change significantly over time?
Yes, staking ratios fluctuate based on network upgrades, validator incentives, market conditions, and broader cryptocurrency adoption trends across different blockchain networks.
Q5: What other metrics complement staking ratio analysis?
Comprehensive network analysis should include developer activity, transaction volumes, application diversity, security audits, and decentralization metrics alongside staking ratios for complete assessment.