BTC Perpetual Futures Long/Short Ratio Reveals Critical Market Balance Across Top Exchanges
Global cryptocurrency traders closely monitor the BTC perpetual futures long/short ratio as a crucial sentiment indicator, with recent data from March 2025 revealing a remarkably balanced market positioning across the world’s largest derivatives platforms. This comprehensive analysis examines the 24-hour positioning data from Binance, Bybit, and OKX, three exchanges that collectively represent over 70% of the total cryptocurrency futures open interest worldwide. The current ratios provide valuable insights into institutional and retail trader sentiment during a period of significant market consolidation following the 2024 Bitcoin halving event.
Understanding BTC Perpetual Futures Long/Short Ratio Dynamics
Perpetual futures contracts represent derivative instruments that never expire, allowing traders to maintain positions indefinitely while paying funding rates periodically. The long/short ratio specifically measures the percentage of open positions betting on price increases versus those anticipating declines. Market analysts consider this metric particularly significant because it reflects real-time trader conviction rather than historical price action. Furthermore, the concentration of this data across major exchanges provides a comprehensive view of global cryptocurrency derivatives sentiment.
Historically, extreme readings in either direction often precede market reversals through contrarian indicators. For instance, when long positions exceed 70%, markets frequently experience corrections as overly optimistic positioning creates vulnerability. Conversely, extreme short positioning below 30% often precedes bullish reversals. The current data shows neither extreme, indicating balanced market psychology. This equilibrium suggests traders remain cautiously positioned despite recent volatility in traditional financial markets.
The Mechanics of Perpetual Futures Trading
Perpetual futures differ from traditional futures through their funding rate mechanism, which adjusts every eight hours to maintain contract prices near underlying spot prices. This structure creates unique dynamics where long/short ratios influence funding rates directly. When longs significantly outnumber shorts, funding rates typically turn positive, requiring long position holders to pay shorts. Currently, the balanced ratios across major exchanges suggest relatively neutral funding rate environments, reducing external pressure on position holders.
Comparative Analysis of Major Exchange Ratios
The following table presents the precise long/short position ratios for BTC perpetual futures across the three largest cryptocurrency derivatives exchanges by open interest:
| Exchange | Long Positions | Short Positions | Net Bias |
|---|---|---|---|
| Overall Aggregate | 49.61% | 50.39% | -0.78% (Slightly Bearish) |
| Binance | 48.72% | 51.28% | -2.56% |
| Bybit | 48.83% | 51.17% | -2.34% |
| OKX | 49.45% | 50.55% | -1.10% |
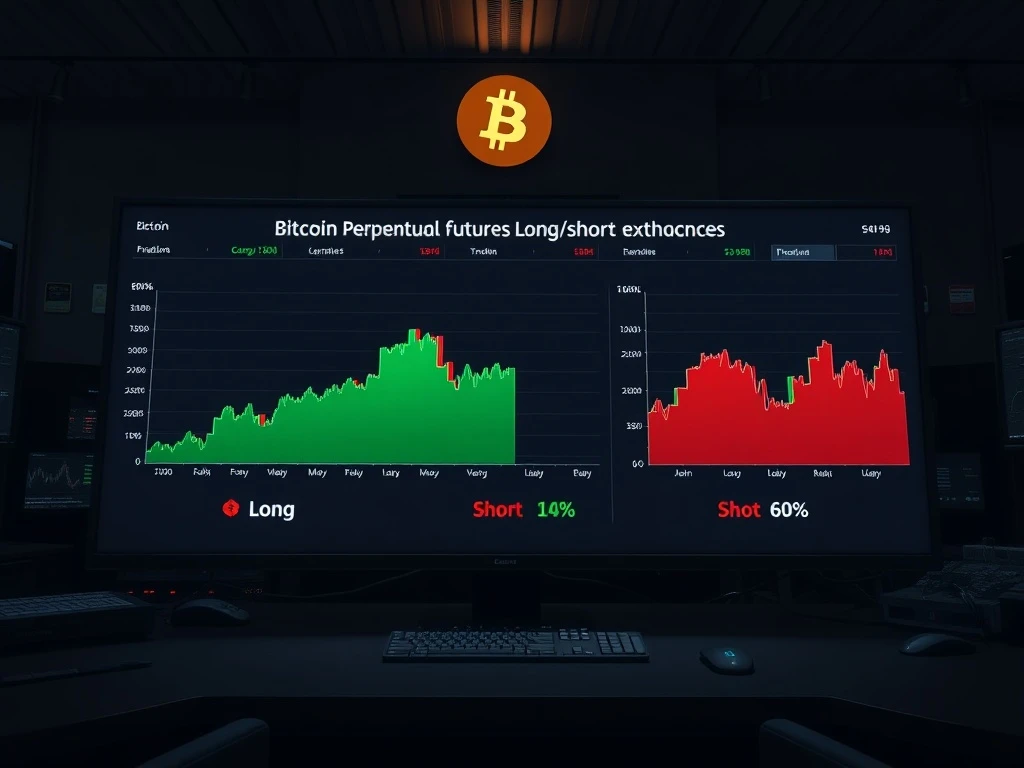
Several important observations emerge from this comparative data. First, all three major exchanges show remarkably similar positioning, with short positions slightly exceeding longs across every platform. This consistency suggests coordinated global sentiment rather than exchange-specific phenomena. Second, OKX demonstrates the most balanced ratio among the three, with only 1.10% net bearish bias compared to approximately 2.5% on Binance and Bybit. This variation may reflect regional trading patterns or different user demographics across platforms.
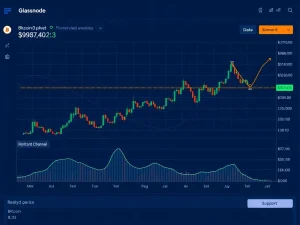
Market structure analysts note that balanced ratios typically correlate with range-bound price action, as neither bulls nor bears establish clear dominance. The current data aligns with Bitcoin’s recent trading pattern between $85,000 and $95,000 throughout early 2025. Additionally, the slight bearish tilt across all exchanges contradicts some traditional sentiment indicators that showed renewed bullishness following recent institutional adoption announcements. This divergence warrants careful monitoring in coming trading sessions.
Historical Context and Market Implications
The current long/short ratio data gains significance when examined against historical patterns. During the 2021 bull market peak, aggregate long positions frequently exceeded 65% across major exchanges, creating extreme positioning that preceded the subsequent correction. Conversely, during the 2022 bear market trough, short positions occasionally surpassed 60%, setting the stage for the 2023 recovery. The present near-equilibrium suggests markets have matured significantly, with traders exhibiting more measured responses to news and price movements.
Several macroeconomic factors likely contribute to the current balanced positioning. First, uncertainty surrounding global interest rate policies in 2025 creates hesitation among leveraged traders. Second, evolving cryptocurrency regulatory frameworks in major economies introduce additional caution. Third, the maturation of institutional participation brings more sophisticated risk management approaches that avoid extreme directional bets. These factors collectively create an environment where moderate positioning becomes the rational default for many market participants.
Exchange-Specific Considerations and Data Reliability
Each exchange’s ratio reflects its unique user base and product offerings. Binance’s data represents the broadest global participation, given its position as the largest cryptocurrency exchange by volume. Bybit’s ratios often show higher retail trader influence, while OKX’s data incorporates significant Asian institutional activity. The consistency across these diverse platforms strengthens the validity of the overall signal. Data collection methodologies also vary slightly between exchanges, but all three platforms calculate ratios based on open interest values rather than position counts, providing more accurate representation of actual capital deployment.
Technical Analysis Integration and Price Action Correlation
Traders frequently combine long/short ratio data with technical analysis to develop more comprehensive market views. The current balanced ratios correspond with several technical indicators showing neutral to slightly bearish signals. Bitcoin’s price remains between key moving averages, with the 50-day and 200-day exponential moving averages converging around $90,000. This technical configuration typically accompanies indecisive markets where neither trend followers nor counter-trend traders establish clear advantage.
Volume analysis provides additional context for interpreting the ratio data. Despite balanced positioning, trading volumes have increased approximately 15% month-over-month, suggesting active position adjustment rather than stagnant markets. This volume increase without corresponding extreme positioning indicates sophisticated position management among larger participants. Options market data further supports this interpretation, with put-call ratios showing similar equilibrium in longer-dated contracts while short-term options exhibit slightly more bearish positioning.
Funding rate analysis completes the derivatives picture. Currently, funding rates across all three exchanges remain near zero, with occasional slight negative readings. This neutral funding environment reduces the cost of maintaining positions and minimizes the mechanical pressure that extreme ratios sometimes create. The combination of balanced long/short ratios, neutral funding rates, and increased volume paints a picture of active but cautious market participation rather than directional conviction.
Institutional Versus Retail Trader Positioning
Advanced data segmentation reveals important distinctions between institutional and retail trader behavior within the aggregate ratios. While precise breakdowns vary by exchange, available data suggests institutions maintain slightly more balanced positioning than retail traders. This divergence reflects different risk management approaches and time horizons. Institutional traders typically employ more sophisticated hedging strategies that may not appear in simple long/short calculations, while retail traders often exhibit clearer directional biases.
The current data shows retail traders maintaining a slightly more bearish stance than institutional counterparts, particularly on platforms with strong retail presence. This pattern contrasts with some previous periods where retail traders exhibited more extreme bullishness during market rallies. The moderation in retail positioning may reflect improved education, better risk awareness, or simply caution following recent volatility. Either interpretation suggests market maturation that could contribute to reduced volatility in future price movements.
Regional Variations and Time Zone Analysis
Geographic analysis provides additional insights when examining exchange-specific data. Asian trading sessions typically show different positioning patterns than European or North American sessions, reflecting regional news flow and trading styles. The current consistency across exchanges suggests synchronized global sentiment rather than region-specific developments. Time-zone analysis of ratio changes throughout the 24-hour period reveals modest fluctuations but maintains the overall balanced profile, indicating sustained rather than transient positioning.
Risk Management Considerations for Current Market Conditions
The balanced long/short ratios present both opportunities and challenges for traders and risk managers. Key considerations include:
- Reduced Contrarian Signals: Balanced ratios provide fewer extreme readings that typically generate high-probability contrarian trades
- Lower Implied Volatility: Options pricing often correlates with positioning extremes, suggesting potential volatility compression
- Funding Rate Stability: Neutral positioning minimizes funding rate volatility, reducing position maintenance costs
- Breakout Vulnerability: Balanced markets sometimes experience sharp moves when unexpected catalysts emerge
- Position Sizing Adjustments: Reduced directional conviction may warrant smaller position sizes or increased hedging
Portfolio managers note that balanced derivatives positioning often coincides with range-bound spot markets, creating opportunities for options strategies like iron condors or calendar spreads that benefit from time decay without strong directional assumptions. However, the potential for sudden volatility spikes requires careful position construction and risk parameter definition.
Conclusion
The BTC perpetual futures long/short ratio across major exchanges reveals a cryptocurrency derivatives market in careful equilibrium during March 2025. With aggregate positioning showing only 0.78% net bearish bias and individual exchange data displaying remarkable consistency, traders demonstrate measured sentiment following significant market developments throughout 2024 and early 2025. This balanced positioning suggests sophisticated risk management has become more prevalent across both institutional and retail participants, potentially indicating market maturation that could influence future volatility patterns. While the current ratios don’t provide strong directional signals, they offer valuable context for understanding market psychology and positioning risk during a period of global economic uncertainty and regulatory evolution in digital asset markets.
FAQs
Q1: What does the BTC perpetual futures long/short ratio actually measure?
The ratio calculates the percentage of open long positions versus short positions in Bitcoin perpetual futures contracts. It reflects trader sentiment and positioning rather than price action, serving as a contrarian indicator at extremes.
Q2: Why do different exchanges show slightly different long/short ratios?
Variations occur due to differences in user demographics, regional trading patterns, product structures, and calculation methodologies. However, consistent directional patterns across major exchanges strengthen signal reliability.
Q3: How often should traders monitor long/short ratio data?
Professional traders typically review daily changes for trend identification while watching for extreme readings that might signal reversals. Intraday monitoring provides less value since meaningful positioning changes usually develop over multiple sessions.
Q4: Can long/short ratios predict Bitcoin price movements?
While not predictive in isolation, extreme ratios often precede reversals when combined with other indicators. Balanced ratios like current readings typically correlate with range-bound or indecisive markets rather than strong trends.
Q5: How does perpetual futures positioning differ from traditional futures?
Perpetual futures never expire and use funding mechanisms to track spot prices, creating different dynamics than dated futures contracts. Their positioning often shows more responsiveness to short-term sentiment while traditional futures reflect longer-term expectations.
Q6: What other metrics should traders combine with long/short ratios?
Effective analysis typically integrates funding rates, open interest changes, volume patterns, options market data, and spot market technicals. This multi-factor approach provides more robust signals than any single metric alone.