ETH/BTC Ratio Reveals Stunning Early Signals of Major 2025 Market Reversal
While Bitcoin’s dollar price dominates headlines, a critical metric watched by seasoned analysts—the ETH/BTC trading pair—is flashing early but compelling signals of a potential market regime change in 2025. This ratio, measuring Ethereum’s value relative to Bitcoin, has historically served as a leading indicator for broader cryptocurrency market rotations. Recent technical patterns and fundamental developments now suggest Ethereum may be preparing for a significant resurgence against its larger rival, potentially marking the early stages of a new altcoin cycle.
ETH/BTC Ratio Technical Analysis Points to Historic Inflection
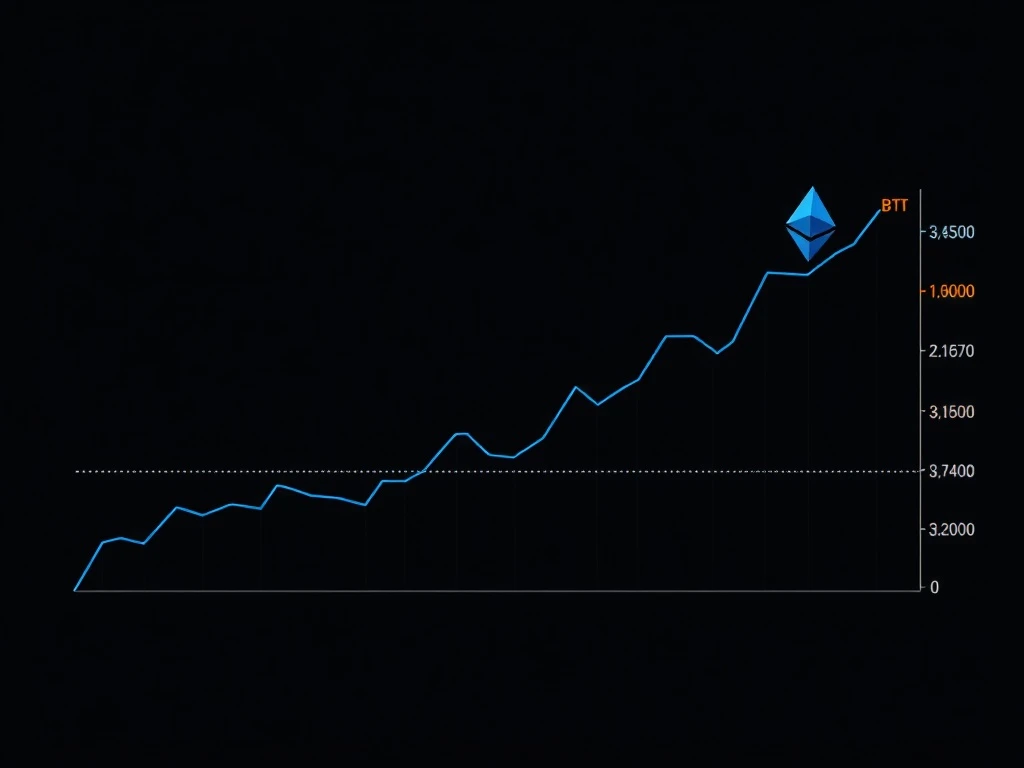
Cryptocurrency analyst Michaël van de Poppe recently highlighted that the ETH/BTC ratio potentially established a significant low in April 2025 around the 0.017 level. This technical event carries substantial weight because it mirrors a similar configuration observed in 2019, which preceded a substantial multi-month rally for Ethereum against Bitcoin. Following this April low, the ratio demonstrated notable strength by climbing to approximately 0.043 by August 2025 before undergoing a expected correction.
Several concurrent technical signals reinforce the reversal hypothesis. Firstly, the ratio has decisively broken above its 365-day simple moving average, a long-term trend indicator that many institutions monitor closely. Secondly, the correction from the August peak to around 0.034 in early 2026 did not retest the April lows, suggesting underlying buying support and a higher low structure—a classic bullish technical formation. Furthermore, market sentiment surveys and social media analysis indicate a pervasive narrative of Ethereum underperformance, which often coincides with major turning points according to contrarian investment principles.
Comparative Analysis with Previous Cycles
The 2019 analogue provides a useful framework. During that cycle, the ETH/BTC ratio bottomed before embarking on a rally that significantly outperformed Bitcoin for an extended period. The current technical setup shares key characteristics with that period, including prolonged underperformance, extreme pessimism, and a clear break of long-term resistance. However, analysts caution that while history often rhymes, it rarely repeats exactly. The current macroeconomic backdrop and regulatory environment differ substantially from 2019, necessitating a nuanced interpretation.
Fundamental Catalysts Supporting an Ethereum Recovery
Beyond chart patterns, robust fundamental developments on the Ethereum network provide a substantive foundation for a potential rally. The ecosystem has demonstrated remarkable growth in key utility metrics throughout 2024 and 2025. Notably, the total supply of stablecoins settled on Ethereum has surged by over 65% in 2025 alone, now doubling the previous peak observed in 2021. According to data from DefiLlama, the aggregate market capitalization of Ethereum-based stablecoins exceeds $163.9 billion, dominated primarily by Tether’s USDT.
This explosive growth in stablecoin adoption serves multiple bullish functions. It indicates Ethereum’s deepening role as the primary settlement layer for digital dollar transactions. It also reflects increased institutional and retail usage for payments, remittances, and decentralized finance (DeFi) operations. Additionally, transfer volume metrics reveal staggering activity, with Token Terminal reporting approximately $8 trillion in stablecoin transfer volume on Ethereum in the fourth quarter of 2024 alone.
- Real-World Asset (RWA) Tokenization: Ethereum is emerging as the leading platform for digitizing traditional assets like treasury bonds, real estate, and commodities. This sector bridges decentralized finance with multi-trillion-dollar traditional markets.
- Sustained Developer Activity: Despite market volatility, GitHub commit data and developer surveys consistently show Ethereum maintaining the largest and most active developer community in blockchain, driving continuous protocol innovation and application development.
- Infrastructure Maturation: Post-Merge upgrades have enhanced network scalability and reduced issuance, creating a structurally sounder economic model for the long term.
Market Structure and Broader Implications
A sustained recovery in the ETH/BTC ratio would signal more than just a pair trade opportunity. Historically, a rising ratio has correlated with increased capital rotation from Bitcoin into the broader altcoin market, often heralding what participants term an “altcoin season.” This dynamic occurs as investor confidence grows, leading them to seek higher beta opportunities beyond the market’s largest asset. The ratio therefore acts as a crucial gauge for overall market risk appetite and sector rotation within the digital asset space.
The current market structure presents a unique confluence of factors. Bitcoin has achieved unprecedented institutional adoption through spot ETFs, potentially stabilizing its price action and reducing volatility. This stability could make Bitcoin function more as a digital reserve asset, while innovation and yield-generation activity increasingly concentrate on smart contract platforms like Ethereum. This functional divergence supports the thesis for a changing performance relationship between the two leading cryptocurrencies.
Institutional Perspective and Data Verification
While analyst commentary provides one viewpoint, verifying on-chain data and institutional flow information adds crucial context. Glassnode and CryptoQuant data indicate that Ethereum’s network activity, measured in fee revenue and active address counts, has remained resilient despite price underperformance. Furthermore, futures market data shows that funding rates and open interest structures for Ethereum are not excessively bullish, suggesting the market is not over-leveraged or euphoric—conditions that typically precede sustainable rallies rather than short-lived spikes.
Conclusion
The convergence of technical signals on the ETH/BTC ratio chart and strengthening fundamental metrics within the Ethereum ecosystem presents a compelling case for a potential market shift in 2025 and beyond. While the dominant narrative has focused on Bitcoin’s solo performance, the relative strength analysis suggests a latent change may be underway. Investors and observers should monitor this critical ratio closely, as its trajectory will likely provide early confirmation of whether capital is beginning to rotate toward the innovation and utility embodied by the Ethereum network and the broader smart contract platform sector. The ETH/BTC ratio remains one of the most insightful metrics for understanding the evolving dynamics within the cryptocurrency market.
FAQs
Q1: What exactly is the ETH/BTC ratio and why is it important?
The ETH/BTC ratio represents how much Bitcoin one Ethereum token can purchase. It’s a crucial metric because it measures Ethereum’s relative strength against Bitcoin, the market leader. A rising ratio indicates Ethereum is outperforming Bitcoin, often signaling increased risk appetite and potential capital rotation into altcoins.
Q2: What technical signals suggest a reversal in the ETH/BTC ratio?
Key signals include a potential double-bottom formation with the April 2025 low, a decisive break above the 365-day moving average, and the establishment of a “higher low” during the recent correction. The pattern bears resemblance to the 2019 cycle, which preceded a significant Ethereum rally.
Q3: What fundamental factors support Ethereum’s potential recovery?
Major fundamental supports include explosive growth in Ethereum-based stablecoin supply (exceeding $163B), massive transfer volumes ($8T in Q4 2024), leadership in Real-World Asset tokenization, and the largest, most active developer community in blockchain driving continuous innovation.
Q4: Does a rising ETH/BTC ratio guarantee an altcoin market boom?
While historically correlated, correlation does not guarantee causation. A rising ratio suggests improving sentiment toward Ethereum specifically, which often spills over to other smart contract platforms. However, macroeconomic conditions and regulatory developments can override this historical relationship.
Q5: How should investors interpret this analysis?
This analysis highlights a developing technical and fundamental thesis, not a prediction. Investors should consider it as one data point among many. Responsible strategy involves considering personal risk tolerance, conducting independent research, and maintaining a diversified portfolio rather than making allocation decisions based on a single ratio or analyst viewpoint.