WBETHUSDT: Unlocking Crucial Insights into Its Recent Bearish Volatility
Are you keeping an eye on the volatile world of crypto? If so, the recent performance of WBETHUSDT has undoubtedly caught your attention. Wrapped Beacon ETH (WBETH) serves as a liquid staking token, representing staked Ethereum (ETH) plus accrued staking rewards. It offers flexibility and liquidity to ETH stakers, allowing them to participate in DeFi while earning rewards. However, even innovative assets like WBETH are subject to the broader forces of the crypto market. Let’s dive deep into the recent movements of WBETHUSDT and uncover what the charts are telling us.
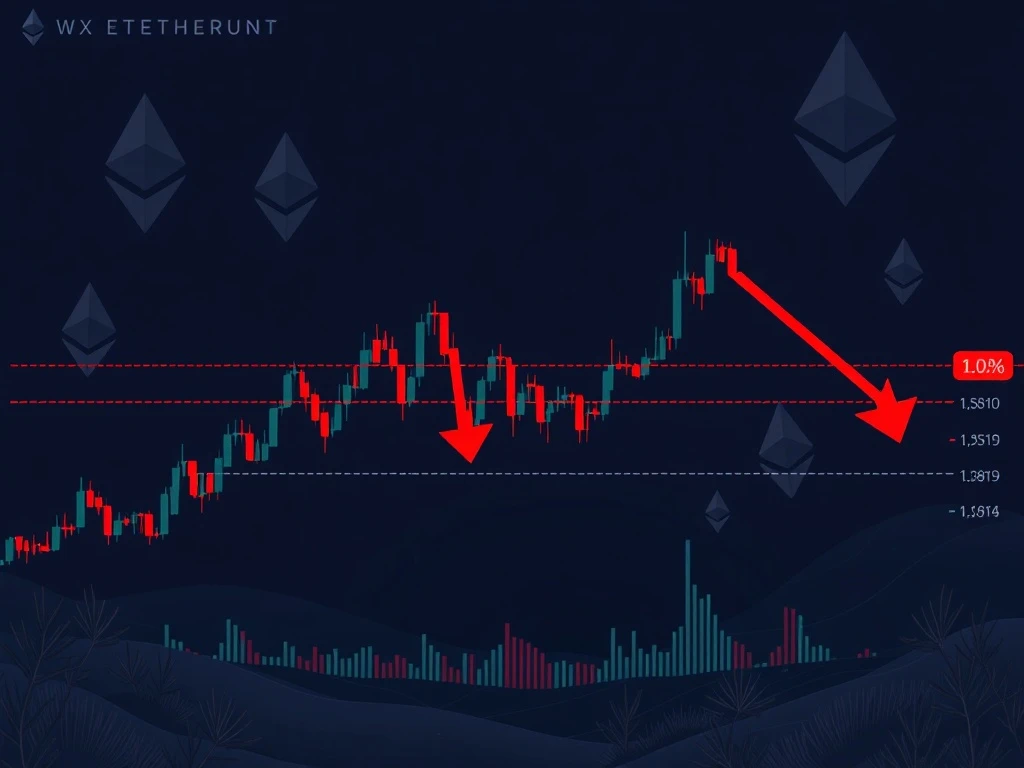
Understanding WBETHUSDT’s Recent Plunge: What Happened?
The past 24 hours have been a turbulent ride for WBETHUSDT holders. The pair experienced a significant 7.4% drop, marked by a sharp sell-off that saw its value plummet from 4,010 down to 3,910. This rapid decline suggests strong bearish pressure, with traders actively liquidating positions or taking profits. The market opened at 3,992.01 on 2025-07-22 at 12:00 ET and closed at 3,910.51 the next day, hitting a high of 4,036.37 and a low of 3,842.42. Such price action is often indicative of a shift in market sentiment, moving from optimism to caution.
The total 24-hour trading volume for WBETHUSDT stood at 359.98 WBETH, translating to a notional turnover of approximately $1,439,619.67. This substantial turnover during the price drop highlights active participation from traders, confirming that this was not just a minor fluctuation but a significant event. A notable bearish engulfing pattern appeared around 17:15 ET, a strong candlestick signal that typically indicates a reversal of an uptrend or continuation of a downtrend, reinforcing the bearish sentiment.
Key Market Data Summary (2025-07-22 12:00 ET to 2025-07-23 12:00 ET):
| Metric | Value |
|---|---|
| Opening Price | 3,992.01 |
| Closing Price | 3,910.51 |
| 24-Hour High | 4,036.37 |
| 24-Hour Low | 3,842.42 |
| Price Change (24h) | -7.4% |
| Total Volume (WBETH) | 359.98 |
| Notional Turnover (USD) | $1,439,619.67 |
Decoding Wrapped Beacon ETH’s Technical Landscape: Support, Resistance, and Patterns
Understanding the underlying structure of price action is paramount in any Wrapped Beacon ETH market analysis. Despite the sharp drop, the key support level at 3,910 was tested twice and held, offering a glimmer of hope for a potential rebound. However, the overall bearish momentum remains strong. Traders should also watch deeper support levels at 3,875 and potentially 3,850. These levels represent price points where buying interest has historically emerged or where selling pressure might abate.
On the flip side, resistance levels have shifted downwards. The previous psychological ceiling of 4,000–4,010 now acts as a strong resistance. Immediate resistance levels are now identified at 3,950 and 3,980. Overcoming these levels would require significant buying pressure. Furthermore, a bearish flag pattern was observed from 19:00 to 21:00 ET. This pattern typically forms after a sharp decline, indicating a temporary pause before a likely continuation of the downtrend. It serves as a warning sign for bulls and a confirmation for bears.
What Do WBETH Price Analysis Indicators Tell Us About the Future?
To gain a comprehensive understanding of the market’s pulse, a detailed WBETH price analysis must incorporate various technical indicators. These tools help traders identify potential trends, momentum shifts, and overbought/oversold conditions. Let’s break down what the key indicators are signaling for WBETHUSDT:
Moving Averages: Trend Confirmation
- On the 15-minute chart, both the 20-period Simple Moving Average (20SMA) and the 50-period Simple Moving Average (50SMA) are currently trading below the price. This configuration typically confirms a short-term bearish bias, indicating that the recent price action is lower than the average prices over these periods.
- Looking at the daily chart, the 50-day Moving Average (50DMA) is approaching the 3,900 level. This longer-term moving average can act as a significant dynamic support or resistance, and its proximity to current price levels suggests it could be a crucial reference point for future price movements. A break below it would be a strong bearish signal.
RSI & MACD: Momentum and Reversal Signals
- The Relative Strength Index (RSI) dropped below 30 during the 19:00–21:00 ET window. An RSI reading below 30 signals oversold conditions, suggesting that the asset may have been sold off too aggressively and could be due for a short-term bounce or correction upwards.
- The Moving Average Convergence Divergence (MACD) line turned negative in the early ET hours, indicating a shift towards bearish momentum. Furthermore, bearish divergence was visible during the sell-off phase, where the price made lower lows but the MACD made higher lows. This can sometimes precede a short-term reversal, especially if the RSI remains above 30 and the MACD shows signs of positive divergence (price making higher lows while MACD makes lower lows, or vice versa for bullish divergence).
Bollinger Bands: Volatility and Price Boundaries
- Bollinger Bands expanded significantly between 17:00 and 20:00 ET, reflecting increased volatility during the intense sell-off phase.
- Since then, the price has consolidated near the lower band. The lower Bollinger Band often acts as a dynamic support level, and prices tend to revert towards the middle band. A break above the mid-band would signal a potential retracement or a temporary relief rally. Conversely, a sustained break below the lower band would confirm further weakness and a continuation of the downtrend.
Volume & Turnover: Conviction Behind the Moves
- Volume spiked dramatically during the 17:00–20:00 ET sell-off, reaching a peak of 19.2463 WBETH at 17:15 ET. High volume accompanying a price drop suggests strong conviction behind the selling pressure, indicating active liquidation or profit-taking rather than just a shallow correction.
- However, the low volume observed during the 10:00–12:00 ET consolidation period after the initial drop suggests weak conviction in any potential rebound. This lack of buying interest during consolidation phases can limit upside potential and make the asset vulnerable to further declines.
Fibonacci Retracements: Pinpointing Reversal Levels
Applying Fibonacci Retracements to the recent 15-minute swing (from the high of 4,036.37 to the low of 3,842.42) provides crucial insights into potential reversal or consolidation points:
- The 38.2% retracement level is at 3,939.39. The price has tested this level, indicating it’s a significant area of interest for traders.
- The 61.8% retracement level, often considered a critical support or resistance, is at 3,890.89. The price is currently consolidating near this level, suggesting it could act as a strong pivot point. A sustained break below 3,890.89 would be a bearish signal, potentially opening the door to further declines.
Navigating Crypto Market Trends with WBETH: What’s Next?
The broader crypto market trends often influence individual assets like WBETH. While Bitcoin and Ethereum typically lead the market, liquid staking derivatives like WBETH can experience amplified movements due to their inherent connection to ETH and the DeFi ecosystem. The recent bearish sentiment in WBETHUSDT could be an isolated event driven by specific market dynamics or a reflection of a wider cautious outlook across the crypto space.
Given the technical readings, a short-term bounce for WBETHUSDT to the 3,950–3,970 range could materialize. This potential bounce would be supported by the oversold conditions indicated by the RSI and the potential for MACD to show positive divergence. However, traders should approach this with caution. The overall bearish momentum remains dominant, and such a bounce might be a relief rally rather than a sustained reversal.
A critical level to watch is 3,910. If WBETHUSDT breaks below this support level with conviction, it would likely trigger further selling pressure, potentially pushing the price towards the deeper support levels at 3,875 or even 3,850. For those considering short-term long positions, a prudent risk management strategy would involve placing a stop-loss order below 3,890, specifically beneath the 61.8% Fibonacci retracement level, to limit potential losses if the bearish trend resumes.
Actionable Insights from Technical Analysis Crypto for Traders
For traders employing technical analysis crypto strategies, the current WBETHUSDT chart presents a complex picture of both immediate downside risk and potential short-term bounce opportunities. It’s crucial to combine these technical insights with sound risk management principles. Always consider your risk tolerance and position sizing. Never invest more than you can afford to lose, especially in a volatile market like cryptocurrency.
Key Takeaways for Traders:
- Bearish Dominance: The overall trend for WBETHUSDT remains bearish in the short term, confirmed by price action, moving averages, and candlestick patterns.
- Critical Support: The 3,910 level is paramount. A sustained break below it could accelerate declines.
- Potential Bounce: Oversold indicators (RSI, MACD) suggest a short-term relief rally is possible, targeting 3,950-3,970.
- Volume is Key: High volume during sell-offs confirms conviction, while low volume during consolidation indicates weak rebound strength.
- Risk Management: For any bullish bets, a stop-loss below 3,890 is highly recommended.
The market is dynamic, and conditions can change rapidly. Staying informed and adapting your strategy based on real-time data and technical confirmations is essential for navigating the complexities of the WBETHUSDT pair.
Conclusion: Navigating the WBETHUSDT Storm
The recent price action of WBETHUSDT underscores the inherent volatility in the crypto market, even for assets linked to foundational projects like Ethereum. While the immediate outlook points to continued bearish pressure, the oversold conditions offer a glimmer of hope for a short-term bounce. Traders and investors must remain vigilant, utilizing the insights from technical indicators and key support/resistance levels to make informed decisions. As the market continues to evolve, disciplined risk management and a keen eye on the charts will be your most valuable tools in navigating the intriguing world of Wrapped Beacon ETH.
Frequently Asked Questions (FAQs)
1. What is Wrapped Beacon ETH (WBETH)?
Wrapped Beacon ETH (WBETH) is a liquid staking derivative token. It represents staked Ethereum (ETH) on the Beacon Chain along with any accrued staking rewards. Unlike directly staked ETH, WBETH is liquid, meaning it can be traded, used in DeFi protocols, or transferred without needing to un-stake your ETH, providing flexibility to stakers.
2. Why did WBETHUSDT experience a significant price drop recently?
The recent 7.4% price drop in WBETHUSDT was driven by strong selling pressure, evidenced by a sharp sell-off from 4,010 to 3,910 and high trading volume during the decline. Technical indicators like a bearish engulfing pattern and a bearish flag pattern also confirmed a shift in sentiment and a continuation of the downtrend.
3. What are the key support and resistance levels for WBETHUSDT to watch?
Key support levels are identified at 3,910 (which held twice), 3,875, and 3,850. These are price points where buying interest might emerge. Key resistance levels, indicating where selling pressure is likely to increase, are 3,950, 3,980, and the psychological ceiling of 4,000–4,010.
4. What do technical indicators like RSI and MACD suggest for WBETHUSDT’s short-term future?
The Relative Strength Index (RSI) dropped below 30, indicating oversold conditions, which often precedes a short-term bounce. The MACD turned negative with bearish divergence, but if the RSI stays above 30 and MACD shows positive divergence, a short-term reversal could be possible. Overall, they suggest the potential for a temporary upward correction due to the intense sell-off.
5. Is WBETH a good investment right now given the current market conditions?
The article provides a technical analysis of WBETHUSDT’s recent performance, highlighting bearish momentum but also potential for a short-term bounce due to oversold conditions. Investment decisions should always be based on your personal financial situation, risk tolerance, and thorough research. While a short-term bounce is possible, the overall trend remains bearish, necessitating caution and strong risk management like setting stop-loss orders.
6. How does WBETH relate to Ethereum liquid staking?
WBETH is a direct product of Ethereum liquid staking. When users stake their ETH with platforms like Lido or Binance, they receive liquid staking tokens (like stETH or BETH). WBETH is a wrapped version of BETH, allowing users to hold a token that represents their staked ETH and its rewards, while still maintaining liquidity to use in other DeFi applications. This mechanism contributes to the broader ecosystem of Ethereum liquid staking, enhancing capital efficiency for stakers.


