Litecoin’s **Crucial** Moment: LTC Price Nears Seven-Year Crypto Breakout

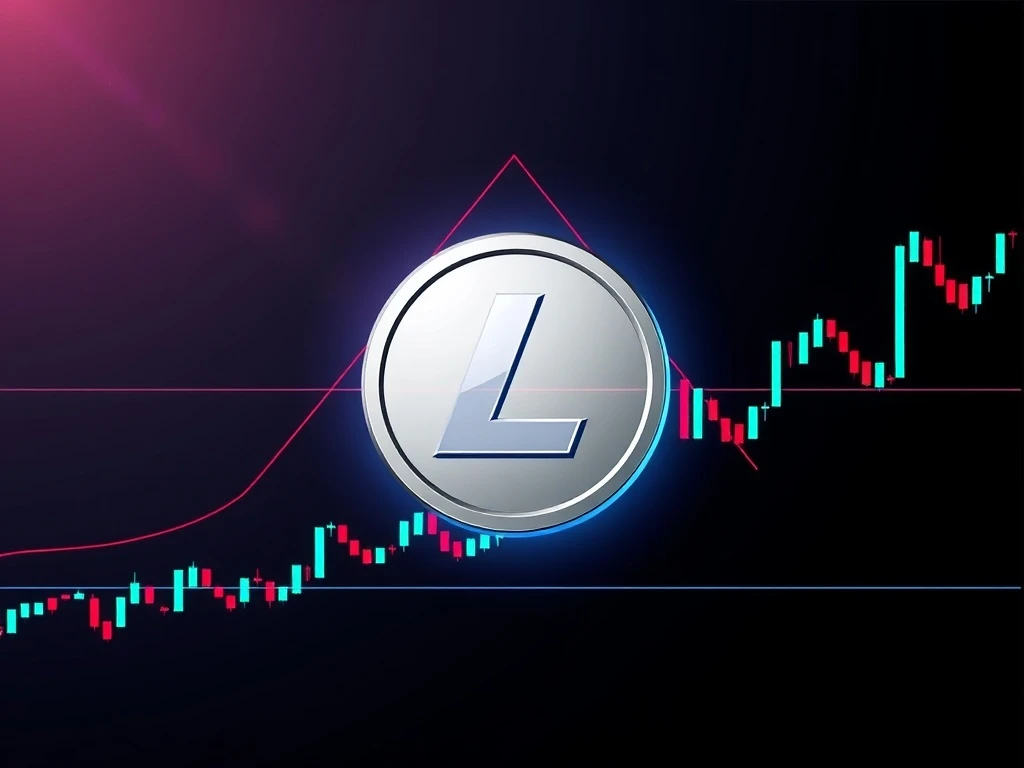
Litecoin, often hailed as the ‘silver to Bitcoin’s gold,’ is currently at a pivotal juncture, capturing the attention of traders and investors alike. The digital asset has recently seen its LTC price surge by 1.88% in 24 hours, climbing from $108 to $115. This movement is not just a daily fluctuation; it represents a critical test of a long-term resistance level within a symmetrical triangle pattern that has been developing for an astonishing seven years. What does this mean for Litecoin’s future, and could we be on the cusp of a significant crypto breakout?
Decoding the Seven-Year Litecoin Triangle: What Does the Technical Analysis Reveal?
For years, Litecoin has been consolidating within a narrowing wedge formation, a classic pattern observed in technical analysis. This pattern is defined by a robust support zone between $60 and $70 and a descending trendline originating from its 2021 highs. Since 2018, the asset’s price structure has consistently respected these boundaries, creating a highly compressed range. The lower boundary, anchored by 2018 lows near $23, has steadily pushed higher lows into the $60-$70 range, while weekly closes have remained within these trendlines, compressing the price range over six years.
Recent intraday volatility, including a morning dip to $108 followed by a recovery to $114, underscores persistent buying pressure as Litecoin approaches the upper boundary of this multi-year formation. This prolonged period of indecision, spanning seven years, reflects a delicate balance between buyers and sellers. However, with the triangle’s apex nearing in late 2025, a decisive resolution is expected soon.
LTC Price Action: Navigating Key Resistance Levels and Market Trends
The current LTC price action is intensely focused on a pivotal resistance cluster between $100 and $112. According to analysts, a sustained breach above this zone could pave the way for a significant move. Mitrade analysts highlight that a breakout above $112 could target the $120-$125 range, marking a crucial psychological and technical threshold. Confirming this level with sustained momentum would validate bullish sentiment and potentially shift the broader market trends for Litecoin.
Conversely, a failure to break above $112 could trigger a pullback. Traders should be aware that such a scenario might lead to a retest of the $90-$100 support zone, an area that aligns with high-volume activity observed between 2019 and 2022. This zone represents a critical line in the sand; holding above it would maintain the bullish outlook, while a decisive drop below could invite further bearish pressure.
Key Price Levels to Watch:
- Immediate Resistance: $100 – $112 (critical cluster)
- Potential Breakout Target: $120 – $125
- Key Support Zone: $90 – $100 (aligned with historical high-volume)
- Long-Term Support: $60 – $70 (symmetrical triangle lower boundary)
Potential Crypto Breakout: What Are the Targets?
The implications of a confirmed crypto breakout from such a long-term pattern are substantial. Based on the triangle’s structure, various technical projections offer potential price targets for Litecoin:
- A 1.618 Fibonacci extension suggests an ambitious target of $650, a level that would surpass Litecoin’s 2021 peak.
- An intermediate target of $295 aligns with prior distribution levels, offering a more conservative yet significant upside.
While some speculative forecasts, like CELOXFI’s aggressive 900% rally projection (though their target of $130, possibly a typo for $130,000, is implausible), underscore the heightened interest, it’s crucial to rely on confirmed signals. Mitrade’s analysis rightly emphasizes that such bullish outcomes are contingent on a sustained break above $112 accompanied by increased trading volume, which would signal strong institutional confidence.
Observing Current Market Trends: Volume and Institutional Confidence
The current weekly candlestick pattern for Litecoin shows a consistent formation of higher lows since mid-2022, a positive sign in technical analysis. However, recent attempts to pierce the resistance have yet to result in a decisive close above it, indicating that the structural testing is ongoing. The absence of significant regulatory or news-driven catalysts in recent weeks means that Litecoin’s next major move will likely be dictated by these underlying technical dynamics.
A confirmed crypto breakout above $112, particularly if accompanied by a surge in volume, could attract broader market participation, including institutional interest. Conversely, a sharp decline below $100 might lead to a retest of the triangle’s lower bounds, suggesting a temporary setback for bullish momentum. Monitoring volume and price behavior closely is paramount for market participants.
Litecoin stands at a fascinating crossroads, with its seven-year consolidation pattern nearing a resolution. The upcoming move, whether an upward crypto breakout or a temporary pullback, will not only define Litecoin’s immediate future but could also influence broader market trends in the altcoin space. As the apex of this long-term triangle approaches, all eyes are on the LTC price, waiting for the definitive signal that will set its next directional path.
Frequently Asked Questions (FAQs)
Q1: What is the significance of the seven-year symmetrical triangle pattern for Litecoin?
A1: The seven-year symmetrical triangle pattern signifies a prolonged period of consolidation where Litecoin’s price has been compressing between converging support and resistance trendlines. Its nearing apex suggests that a significant directional move, either a breakout or a breakdown, is imminent, ending years of indecision.
Q2: What key price levels should investors watch for Litecoin (LTC)?
A2: Investors should closely monitor the $100-$112 resistance cluster. A sustained break above $112 could signal a bullish crypto breakout. On the downside, the $90-$100 zone acts as a critical support. A fall below this level could indicate a retest of the triangle’s lower bounds, potentially around $60-$70.
Q3: What are the potential price targets if Litecoin experiences a crypto breakout?
A3: Based on technical analysis, if Litecoin confirms a bullish breakout, an intermediate target could be around $295. More ambitious Fibonacci extensions suggest a long-term target of $650, which would surpass its previous all-time high.
Q4: How important is trading volume in confirming a Litecoin breakout?
A4: Trading volume is extremely important. A significant increase in volume accompanying a price break above resistance (e.g., $112) provides strong validation for the breakout. High volume indicates strong buying pressure and institutional confidence, making the move more sustainable. Without increased volume, a breakout might be a ‘fakeout’.
Q5: What factors are currently influencing Litecoin’s price action?
A5: Currently, Litecoin’s price action is primarily driven by technical dynamics, particularly its position within the long-term symmetrical triangle. The article notes an absence of significant regulatory or news-driven catalysts, meaning market participants are largely reacting to chart patterns and key support/resistance levels.
Q6: What does the term ‘technical analysis’ mean in the context of Litecoin?
A6: Technical analysis in the context of Litecoin involves studying historical price charts and volume data to predict future price movements. This includes identifying patterns like the symmetrical triangle, drawing trendlines for support and resistance, and using indicators like Fibonacci extensions to project potential price targets.


