Ethereum Price Alert: Imminent $979M Liquidation Threat Looms for ETH

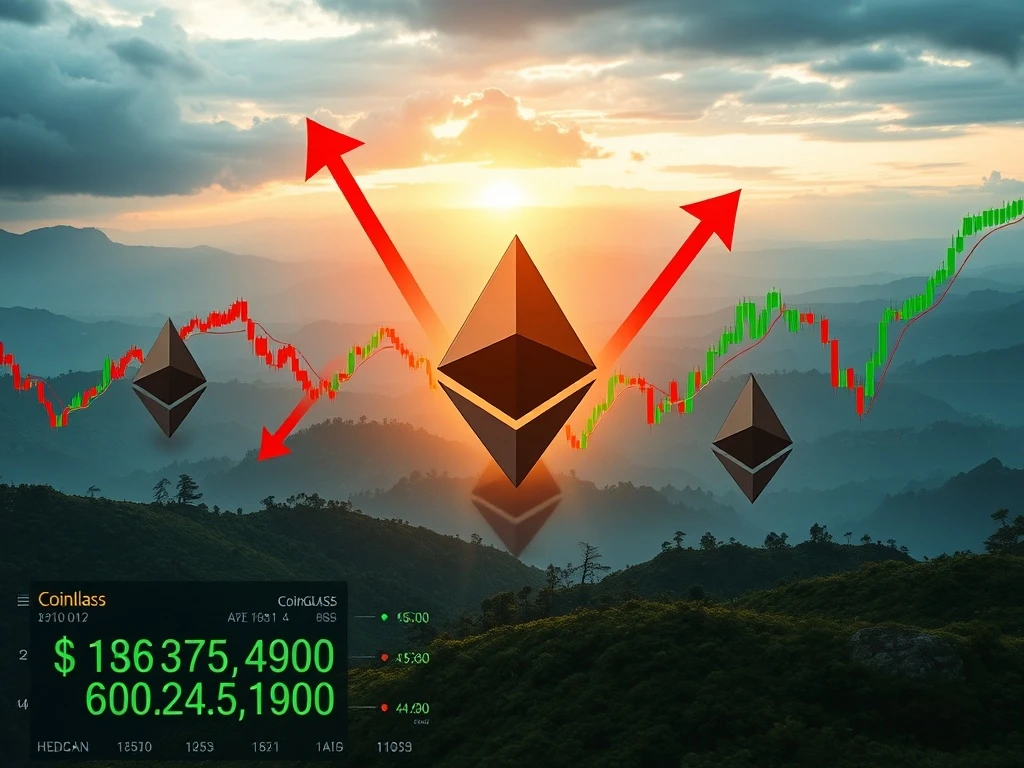
Are you holding Ethereum (ETH) or considering a trade? Recent Ethereum news indicates that the cryptocurrency is hovering near critical price points that could trigger massive market shifts. Data from Coinglass highlights significant liquidation risks at the $4,000 and $3,800 levels, posing a collective threat of nearly $2 billion in potential liquidations. Understanding these thresholds is crucial for navigating the current Ethereum price action and managing your exposure to heightened market volatility.
Decoding the Threat: What Are Crypto Liquidations?
Before diving into the specifics of Ethereum’s current predicament, let’s clarify what ‘liquidations’ mean in the crypto world. In simple terms, a liquidation occurs when an exchange forcefully closes a trader’s leveraged position due to a loss of initial margin. This happens when the market moves against a trader’s bet, and their collateral is no longer sufficient to maintain the position. It’s a critical mechanism in leveraged trading that can amplify price movements.
- Long Liquidations: Occur when the price of an asset drops significantly, forcing traders who bet on price increases (long positions) to close their trades.
- Short Liquidations: Happen when the price of an asset rises sharply, forcing traders who bet on price decreases (short positions) to close their trades.
- Cascading Effect: Large-scale liquidations can create a ‘domino effect,’ where forced closures push prices further in one direction, triggering more liquidations, and so on. This contributes significantly to market volatility.
Coinglass Data Unveils Critical Ethereum Price Levels
According to analysis of Coinglass data by COINOTAG, Ethereum’s current price movements are drawing close attention to two key levels: $4,000 and $3,800. These aren’t just arbitrary numbers; they represent significant clusters of leveraged positions that, if breached, could lead to substantial forced closures.
Here’s a breakdown of the potential impact:
- Breaking Above $4,000: If the Ethereum price surges past the $4,000 mark, approximately $979 million worth of short positions could face liquidation. This scenario could trigger a ‘short squeeze,’ where short sellers are forced to buy ETH to cover their positions, further propelling the price upward.
- Dropping Below $3,800: Conversely, a fall below $3,800 could result in $917 million in long position liquidations. This would create a ‘long squeeze,’ where forced selling by long position holders could accelerate the downward trend.
These figures are not just abstract numbers; they represent the immense capital at risk and the potential for rapid, unpredictable price swings. The liquidation intensity charts from Coinglass visually represent these zones, indicating where ‘liquidity waves’ are strongest.
Why Do These Liquidation Zones Act as Dynamic Support and Resistance?
Traders and analysts often view these high-intensity liquidation zones as more than just points of risk; they can also function as dynamic support and resistance levels. When a price approaches such a zone, the sheer volume of potential liquidations can either reinforce a trend or cause an abrupt reversal.
For instance, if the Ethereum price is pushing towards $4,000, the anticipation of a short squeeze might deter new short positions, while aggressive buyers might step in, hoping to capitalize on the forced buying. This can turn $4,000 into a strong resistance that, once broken, transforms into powerful support. The same logic applies to the $3,800 level, where a breakdown could quickly turn support into resistance as long positions are wiped out.
Understanding this dynamic is a cornerstone of advanced risk management in crypto trading. It helps market participants anticipate reactions rather than just react to them.
Navigating Market Volatility: Actionable Insights for Traders
Given the significant liquidation risks highlighted by Coinglass data, how should traders and investors approach the current Ethereum news? The key lies in informed decision-making and robust risk management strategies.
Here are some actionable insights:
- Monitor Liquidation Heatmaps: Regularly check liquidation heatmaps and data provided by platforms like Coinglass. These tools offer real-time insights into where major liquidation clusters lie, helping you identify potential pivot points.
- Adjust Leverage Wisely: If you’re using leverage, consider reducing your exposure around these critical price levels. High leverage amplifies both gains and losses, making you more susceptible to sudden liquidation.
- Implement Strict Stop-Loss Orders: Always use stop-loss orders to limit potential losses. Place them strategically outside known liquidation zones, or adjust them dynamically as the market moves.
- Diversify Your Portfolio: Don’t put all your eggs in one basket. While Ethereum is a major asset, diversifying across different cryptocurrencies can mitigate risk.
- Stay Informed: Keep up with the latest Ethereum news and broader market trends. Geopolitical events, regulatory changes, and macroeconomic factors can all influence crypto prices and liquidation events.
- Practice Patience: In highly volatile markets, sometimes the best action is no action. Avoid impulsive trades based on fear or greed.
The Broader Implications of Crypto Liquidations on Market Stability
The impact of large-scale crypto liquidations extends beyond individual traders. They can significantly affect overall market stability. When cascades of liquidations occur, they can:
- Amplify Price Swings: Forced buying or selling due to liquidations can create rapid and extreme price movements, leading to flash crashes or parabolic surges.
- Increase Uncertainty: High volatility fueled by liquidations makes it difficult for new capital to enter the market, as investors become wary of unpredictable movements.
- Test Exchange Infrastructure: During periods of intense liquidation, exchanges can experience high traffic and strain, potentially leading to technical issues.
While these events are a natural part of leveraged markets, their magnitude in cryptocurrencies, especially for assets like Ethereum, underscores the need for constant vigilance and sophisticated tools like Coinglass data for comprehensive market analysis.
Conclusion: Navigating Ethereum’s Volatile Path
The current Ethereum price action near $4,000 and $3,800 highlights a period of heightened risk and opportunity. With nearly $2 billion in potential crypto liquidations looming, understanding the dynamics of these thresholds is paramount for anyone involved in the crypto space. The insights from Coinglass data provide a critical predictive tool, allowing traders to anticipate market reactions and adjust their strategies proactively. As market volatility remains a defining characteristic of cryptocurrencies, staying informed, managing leverage, and implementing robust risk management practices are your best defense against sudden market shocks. The next move for Ethereum could be explosive, making informed decisions more vital than ever.
Frequently Asked Questions (FAQs)
What are the primary liquidation risks for Ethereum (ETH) currently?
According to Coinglass data, Ethereum faces approximately $979 million in short position liquidations if its price breaks above $4,000, and about $917 million in long position liquidations if it drops below $3,800. These levels pose significant risks due to large clusters of leveraged positions.
How does Coinglass data help traders?
Coinglass provides valuable data, including liquidation heatmaps and intensity charts, which help traders identify significant price levels where large volumes of leveraged positions could be liquidated. This information acts as a predictive tool, allowing traders to anticipate potential market reactions and adjust their strategies, especially concerning Ethereum price movements.
What is the difference between long and short liquidations?
Long liquidations occur when the price of an asset falls, forcing traders who bet on price increases to close their positions. Short liquidations happen when the price rises, forcing traders who bet on price decreases to close their positions. Both can trigger cascading effects and increase market volatility.
Why are these specific Ethereum price levels ($4,000, $3,800) so critical?
These levels are critical because they represent price points where a substantial amount of leveraged positions are concentrated. Breaching these thresholds could trigger a chain reaction of forced closures, leading to rapid and amplified price swings due to the sheer volume of potential crypto liquidations at stake.
What steps can traders take to mitigate risks during high market volatility?
To mitigate risks, traders should monitor liquidation data, use appropriate leverage, implement strict stop-loss orders, diversify their portfolios, and stay updated on the latest Ethereum news and broader market trends. Avoiding impulsive decisions and focusing on risk management are key.


