Crypto Price Prediction: ThorChain (RUNE), Flare, Tron
Cryptocurrencies had a mixed week after Grayscale scored a major victory against the Securities and Exchange Commission (SEC). That verdict led to a major rebound of most cryptocurrencies like Bitcoin and Litecoin.
The gains were short-lived after the SEC decided to delay its decision on several ETF proposals by companies like Blackrock, Invesco, and WisdomTree. This artcle looks at some of the top coins to watch this weekend, including Flare, Tron, and ThorChain (RUNE).
Flare price prediction
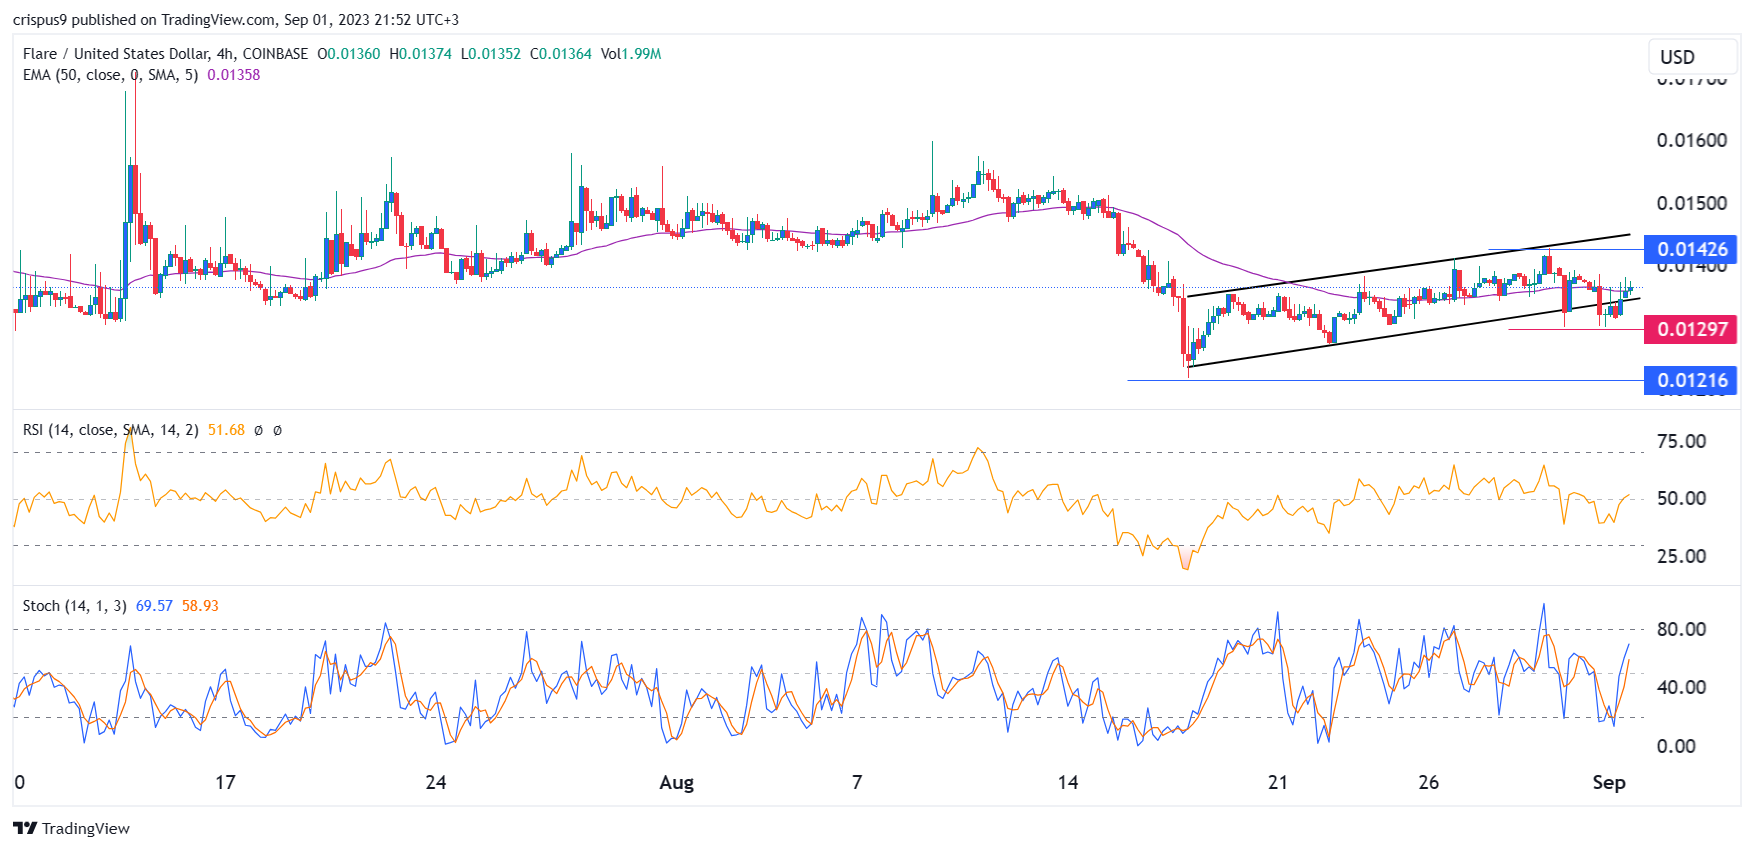
Flare price has moved sideways in the past few weeks. On the four-hour chart, we see that the coin has formed an ascending channel shown in black. This channel has seen it rise from a low of $0.012 on August 18th to the current $0.018.
Flare is consolidating at the 50-period and 25-period moving averages. It has also moved back to the lower side of the ascending channel. At the same time, the Relative Strength Index (RSI) and the Stochastic Oscillator (SO) have drifted upwards.
The outlook for the FLR token is mildly bullish as buyers target the upper side of the channel at $0.014. The alternative scenario is where the token makes a bearish breakout and retests the support at $0.012.
Tron price prediction
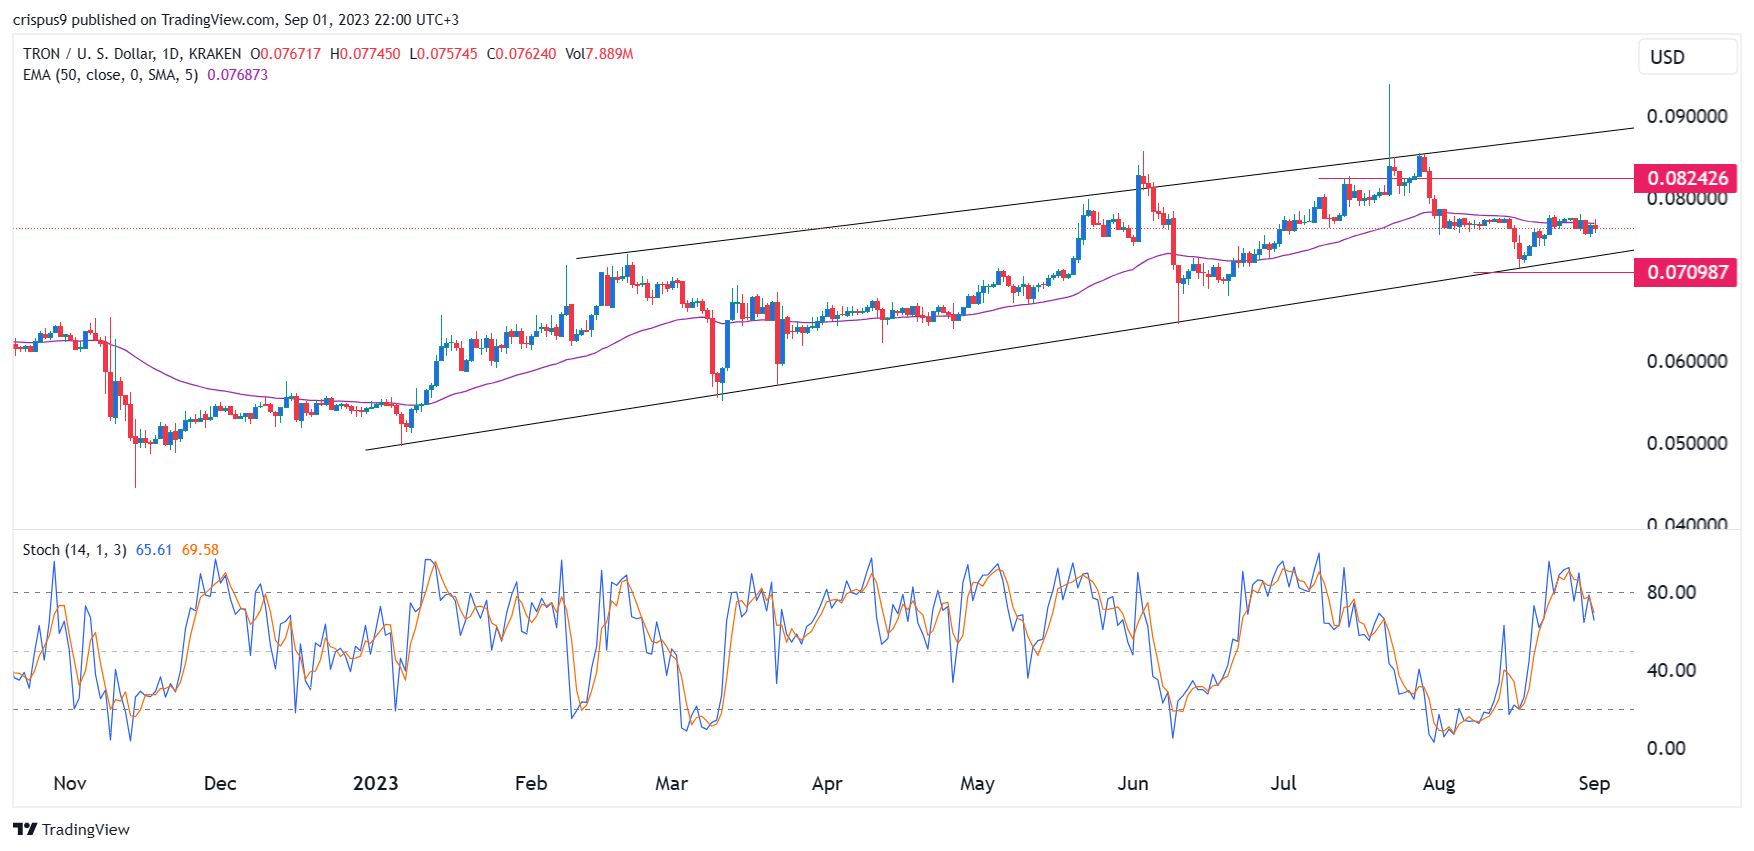
Tron price has been in a tight range in the past few days. It was trading at $0.076, where it has been since mid-August. The coin is consolidating at the 50-day moving average.
On the daily chart, the coin has formed an ascending channel shown in black. The lower side of the channel connected the lowest levels since January 6th. At the same time, the price is at the Woodie pivot point while the Stochastic Oscillator has moved below 80.
Therefore, Tron price will likely remain in this range during the weekend. The key support and resistance levels to watch will be at $0.070 and $0.08.
ThorChain price prediction
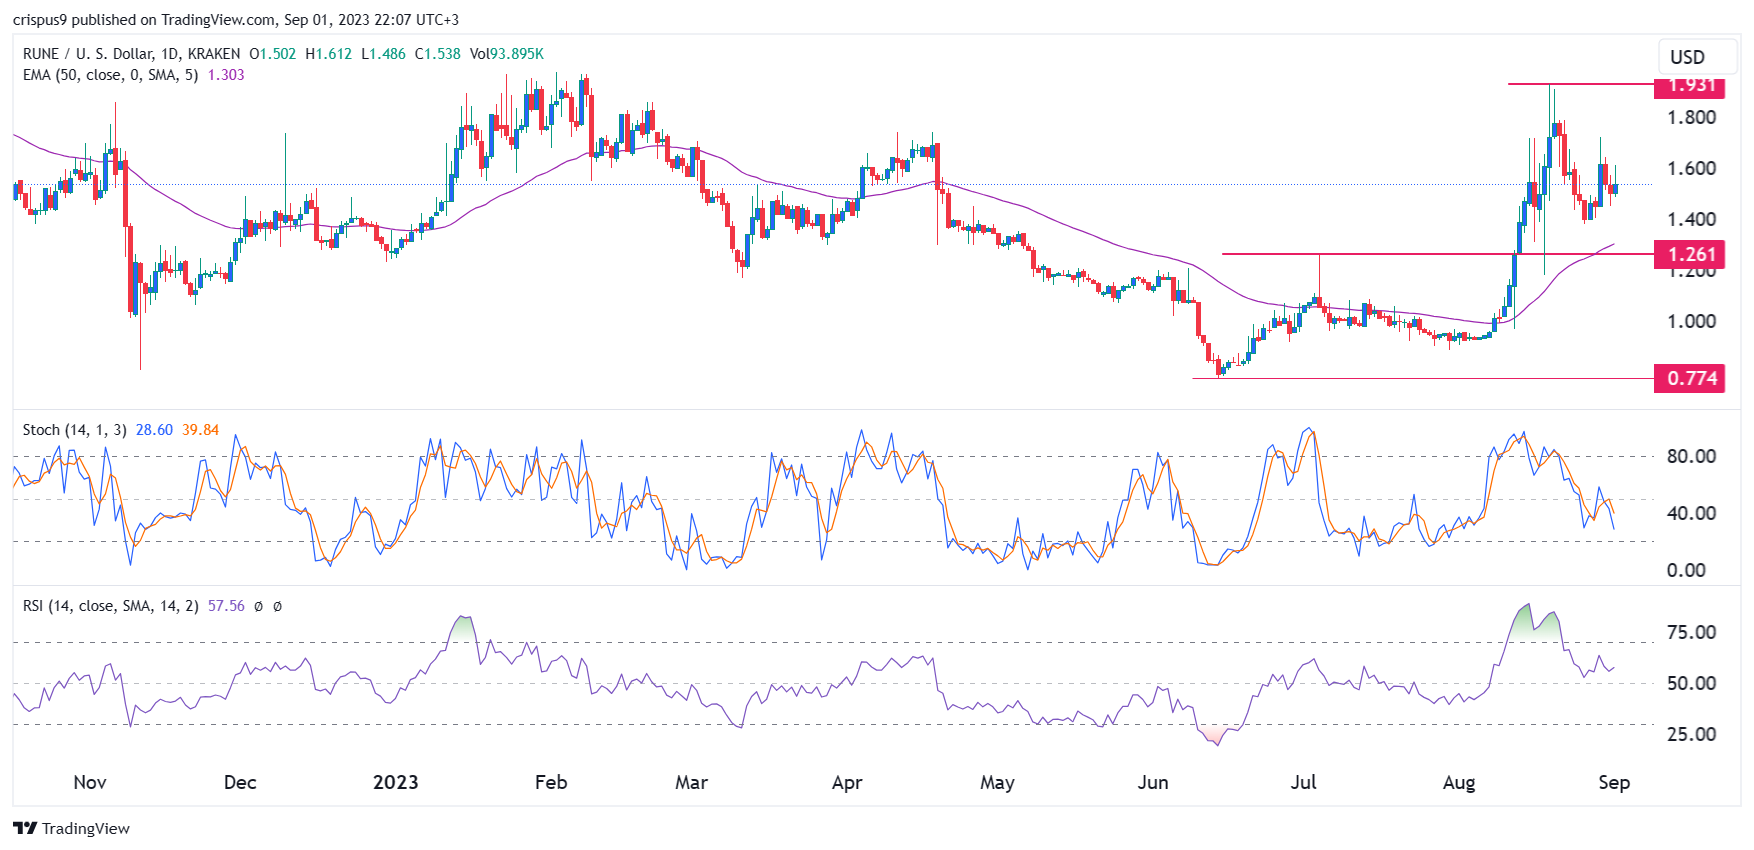
ThorChain price has been one of the best-performing cryptocurrencies since June. The token surged from a low of $0.77 in June to a high of $1.93 in August. On the daily chart, the token has Jumped above the 50-day and 25-day moving averages.
The Stochastic Oscillator has moved below the neutral level of 40 while the Relative Strength Index (RSI) has formed a bearish divergence pattern. ThorChain seems to be forming a double-top pattern, meaning that the price could retest the upper side at $1.93.
