Bitcoin News Today: Unveiling the Crucial Breakout as Price Action Signals Uncertainty
The cryptocurrency world is holding its breath as Bitcoin News Today centers on a critical development: Bitcoin’s price action has converged into a symmetrical triangle pattern, signaling an imminent, decisive move. This formation, a hallmark of market indecision, suggests that a significant breakout or breakdown is on the horizon, potentially reshaping the landscape for the entire crypto market.
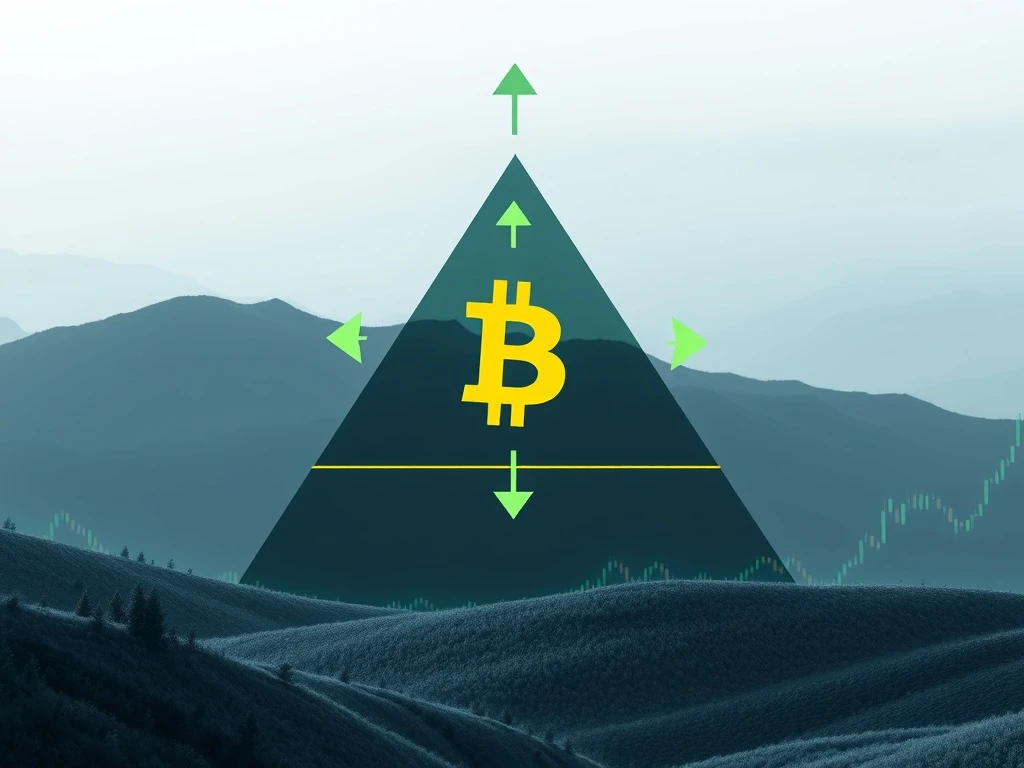
Bitcoin’s Symmetrical Triangle: What Does it Mean for Traders?
For weeks, the Bitcoin price has been consolidating within a tight range, creating a classic symmetrical triangle pattern. This chart formation is characterized by converging trendlines – lower highs and higher lows – indicating that buyers and sellers are reaching a stalemate. Currently trading near $118,520, Bitcoin is squeezed between a steadfast $118,000 support and a stubborn $119,300 resistance. Historically, a symmetrical triangle precedes a strong directional move once the price breaks out of its boundaries. The longer the consolidation, the more explosive the potential move.
- Converging Trendlines: Price highs are getting lower, and price lows are getting higher.
- Indecision Phase: Reflects a balance between buying and selling pressure.
- Precursor to Volatility: Often resolves with a sharp move in either direction.
Deciphering the Technical Analysis Signals
To understand the potential trajectory, traders are keenly observing various indicators. The Relative Strength Index (RSI) currently sits at 48.63, firmly in a neutral zone, echoing the market’s indecision. Similarly, the Moving Average Convergence Divergence (MACD) shows weak positive momentum, offering little strong directional bias. However, the Ichimoku Cloud analysis presents a glimmer of bullish hope; Bitcoin’s price remains above the green cloud, traditionally a bullish signal, suggesting underlying strength despite the current consolidation.
These mixed signals from technical analysis tools underscore the complexity of the current market environment. While some indicators lean slightly bullish, none offer a definitive prediction, keeping traders on edge.
The Volume and Open Interest Puzzle: What’s Driving the Uncertainty in the Crypto Market?
Adding to the cautious sentiment are the latest volume and open interest figures. A notable 15% decline in trading volume, dropping to $90.8 billion, indicates reduced participation and liquidity. This lower volume often accompanies consolidation phases, but it also means that a breakout, when it occurs, might be more volatile due to less resistance. Concurrently, open interest (OI) has seen a 1.81% decline to $84.22 billion, reflecting a reduction in leveraged positions. This suggests that fewer traders are willing to place large bets on Bitcoin’s immediate direction, preferring to wait for clearer signals.
The reduced trading activity and leveraged interest highlight a collective “wait and see” approach across the broader crypto market, intensifying the suspense around Bitcoin’s next move.
Navigating Key Bitcoin Price Levels: Support and Resistance
The immediate landscape for Bitcoin price action is defined by critical support and resistance levels. A successful breach above $118,800 and subsequently $119,300 could ignite a rally towards $119,800 or even $120,500, validating a bullish breakout from the symmetrical triangle. This would be a strong signal for continuation of the uptrend.
Conversely, a breakdown below the crucial $118,000 support level would be a bearish development, potentially leading to a retest of $117,500. Further losses could see Bitcoin sliding towards $117,100, invalidating the bullish bias from the Ichimoku Cloud and signaling a deeper correction. The 4-hour chart clearly illustrates this tight tug-of-war near the triangle’s apex, where every price movement is scrutinized.
Analyst Outlook: Diverse Predictions for Bitcoin’s Next Move
Market participants and analysts are sharply divided on where Bitcoin News Today will lead us next. Some analysts maintain a strong bullish outlook, projecting a potential move towards $150,000 if the symmetrical triangle validates with an upward breakout. Their reasoning often hinges on Bitcoin’s historical performance after similar consolidation patterns and strong long-term fundamentals.
However, a significant portion of the analytical community warns of a potential pullback. They suggest that a drop below $115,724 could trigger a “bull trap,” leading to a retest of earlier, lower support levels. This bearish scenario highlights the fragility of the current market structure and the importance of confirming the breakout direction with significant volume.
Beyond Bitcoin: Ripple Effects Across the Crypto Market
While Bitcoin takes center stage, its consolidation has a ripple effect across the entire crypto market. Ethereum (ETH) and XRP, for instance, are exhibiting similar range-bound behavior, reflecting the broader uncertainty. Bitcoin’s dominance remains pivotal; its decisive move, whether up or down, is highly likely to influence risk appetite and directional momentum for altcoins. Traders are not only watching Bitcoin but also the broader macroeconomic cues and regulatory updates globally, as these external factors could provide the necessary catalyst to tip the balance once the triangle pattern resolves.
In essence, the symmetrical triangle is acting as both a catalyst for potential volatility and a barrier to immediate clarity. The market remains in a holding pattern, awaiting the definitive signal that will dictate the next major trend for Bitcoin and, by extension, the entire digital asset space.
Frequently Asked Questions (FAQs)
Q1: What is a symmetrical triangle pattern in Bitcoin’s price chart?
A symmetrical triangle is a chart pattern characterized by converging trendlines, where both resistance and support lines are sloping towards a central point. It indicates a period of consolidation and indecision, often preceding a significant price breakout in either direction.
Q2: Why are volume and open interest declines significant for Bitcoin?
A decline in trading volume suggests reduced market participation and liquidity, which can make a breakout more volatile. A drop in open interest, representing leveraged positions, indicates that fewer traders are taking large directional bets, reflecting increased caution and uncertainty in the market.
Q3: What are the key price levels to watch for Bitcoin’s breakout?
For a bullish breakout, traders are watching resistance levels at $118,800 and $119,300, with potential targets at $119,800 or $120,500. For a bearish breakdown, the critical support is $118,000, with further downside targets at $117,500 and $117,100.
Q4: How does Bitcoin’s symmetrical triangle affect the broader crypto market?
Bitcoin’s price movements often dictate the overall sentiment and direction of the cryptocurrency market due to its dominance. A decisive breakout from its symmetrical triangle pattern is likely to influence risk appetite and price action across altcoins like Ethereum and XRP, leading to similar directional moves.
Q5: What do technical indicators like RSI and MACD suggest about Bitcoin’s current state?
The RSI (Relative Strength Index) at 48.63 indicates a neutral zone, showing neither overbought nor oversold conditions, reflecting market indecision. The MACD (Moving Average Convergence Divergence) shows weak positive momentum, suggesting a lack of strong bullish conviction. Both indicators underscore the current stalemate between buyers and sellers.


