Bitcoin Price: Crucial RSI Lows Unveil Potential Recovery After Galaxy Digital Sell-Off
The cryptocurrency market is currently witnessing a fascinating tug-of-war, with recent events painting a complex picture for the future of Bitcoin price. A significant market event—a massive sell-off by Galaxy Digital—has sent ripples across the ecosystem, pushing key technical indicators to extreme levels. But could these very extremes be signaling an impending turnaround? Let’s dive into the details shaping Bitcoin’s trajectory today.
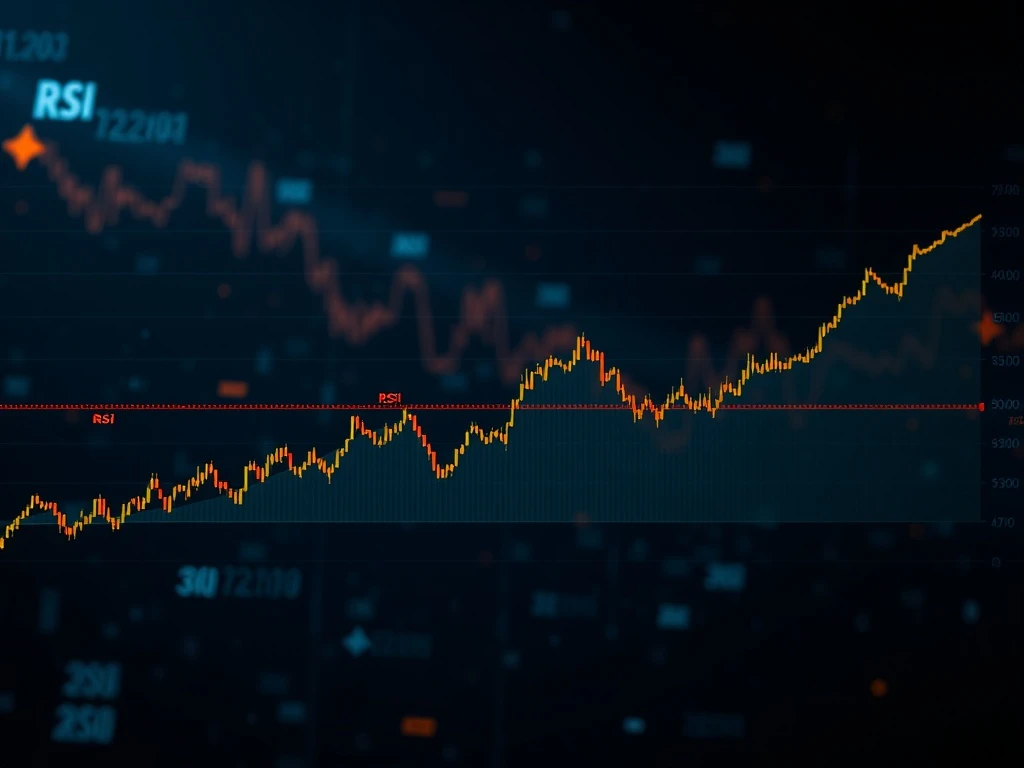
What Does a Historic Bitcoin RSI Low Mean for the Market?
On July 25, 2025, the crypto world watched as Bitcoin RSI (Relative Strength Index) plummeted to single digits on short timeframes. This is a rare occurrence, signaling that Bitcoin has become extremely oversold. The RSI is a momentum oscillator that measures the speed and change of price movements. Typically, an RSI reading below 30 indicates oversold conditions, suggesting that the asset might be undervalued and due for a price correction or rebound. When it hits single digits, as seen recently, it’s an even stronger signal of potential selling exhaustion. Technical analysts have noted a crucial divergence: while Bitcoin’s price formed lower lows, the RSI began creating higher lows. This bullish divergence often foreshadows a reversal, indicating that the selling pressure is decelerating, even if the price continues its downward trend for a short period. This pattern is a key indicator for traders looking for a potential bounce back.
How Did the Galaxy Digital Sell-Off Impact Bitcoin Price?
The primary catalyst for this dramatic market movement was a substantial Galaxy Digital sell-off. On July 25, 2025, Galaxy Digital initiated the transfer of approximately 80,000 BTC to various exchanges. These were assets that had been dormant for over a decade, making their sudden movement particularly impactful. This influx of supply into the market triggered over $500 million in liquidations within 24 hours, exacerbating downward pressure on Bitcoin’s price. Such large-scale transfers from long-term holders can significantly shift market dynamics, especially when they involve dormant coins, as it signals a change in long-term conviction or strategic rebalancing. The sheer volume of this sell-off contributed directly to the extreme oversold conditions observed in Bitcoin’s RSI.
Is a BTC Recovery on the Horizon? Analyzing Key Support Levels
Despite the significant selling pressure, the market is showing signs that a BTC recovery might be brewing. A critical factor in this potential rebound is the market’s ability to hold crucial support levels. COINOTAG sources highlight $117,000 as a key resistance level, indicating where sellers are likely to step in and prevent further upward movement. More importantly, bid support is currently holding strong near $114,500. This $114.5K level has proven to be a robust area where buyers are willing to step in, preventing further price declines. The concentration of ask orders up to $118,500 defines a clear trading range, suggesting that market participants are actively positioning themselves for either a breakout above resistance or consolidation within this range. The relatively orderly absorption of spot market selling, without extreme panic or capitulation levels, further supports the idea that the market is stabilizing.
Navigating the Market: Actionable Insights for Bitcoin Support and Beyond
For traders and investors navigating this volatile environment, a measured approach is essential. Monitoring key technical indicators, especially the Bitcoin support levels, can provide valuable insights. The $114,500 and $117,000 thresholds are critical benchmarks. A sustained hold above $114,500 could confirm the strength of the current support and pave the way for a recovery towards $117,000 and potentially higher. Conversely, a decisive break below $114,500 could signal further downside. Beyond technical analysis, keeping an eye on broader market sentiment, liquidation heatmaps, and order book depth can offer a more comprehensive view of liquidity and potential price movements. While the current oversold conditions suggest a high probability of a rebound, the market’s capacity to absorb continued large-scale sell-offs will be crucial. Remaining agile and adapting strategies based on real-time market developments is key to managing risk effectively.
Conclusion: A Cautious Optimism for Bitcoin’s Path Forward
The recent market turbulence, largely driven by the Galaxy Digital sell-off, has tested Bitcoin’s resilience. However, the dramatic drop in Bitcoin RSI to historic lows, coupled with strong support holding at $114.5K, offers a glimmer of hope for a potential BTC recovery. While challenges remain, the absence of widespread panic and the orderly absorption of selling pressure suggest a market that is consolidating rather than collapsing. As Bitcoin navigates these critical price levels, market participants will be closely watching for signs of a sustained rebound, with the interplay of technical signals and institutional movements dictating its short-term direction. The coming days will be pivotal in determining if this historic oversold condition indeed marks a turning point for the world’s leading cryptocurrency.
Frequently Asked Questions (FAQs)
Q1: What is the Relative Strength Index (RSI) and why is it important for Bitcoin?
A1: The Relative Strength Index (RSI) is a momentum indicator used in technical analysis that measures the speed and change of price movements. It oscillates between 0 and 100. For Bitcoin, an RSI below 30 typically indicates that the asset is oversold and might be due for a price rebound, while an RSI above 70 suggests it’s overbought and might be due for a correction. A single-digit RSI, as seen recently, signifies extremely oversold conditions, often preceding a significant price recovery.
Q2: How did Galaxy Digital’s BTC sell-off impact the market?
A2: Galaxy Digital’s transfer of approximately 80,000 BTC, which had been dormant for over a decade, to exchanges significantly increased the supply of Bitcoin available for sale. This massive influx led to over $500 million in liquidations within 24 hours, creating substantial downward pressure on Bitcoin’s price and contributing to its RSI plummeting to historic lows.
Q3: What are the key support and resistance levels for Bitcoin right now?
A3: According to market analysis, $114,500 is identified as a critical bid support level where buyers are actively stepping in to prevent further declines. On the other hand, $117,000 is highlighted as a key resistance level, indicating where sellers are likely to emerge and potentially halt upward price movements. The range up to $118,500 also shows a concentration of ask orders, defining the current trading range.
Q4: Does an extremely low RSI guarantee a Bitcoin price recovery?
A4: While an extremely low RSI (like single digits) strongly suggests that an asset is oversold and due for a rebound, it does not guarantee an immediate or sustained recovery. It signals a high probability of selling exhaustion. Traders often look for other confirmations, such as bullish divergences (RSI making higher lows while price makes lower lows) and strong support levels holding, to validate a potential recovery. The overall market sentiment and continued institutional movements also play a significant role.
Q5: What should traders monitor after a major sell-off like this?
A5: Traders should closely monitor the critical support and resistance levels ($114,500 and $117,000), the Relative Strength Index (RSI) for signs of a sustained rebound, and trading volume to gauge market sentiment. Additionally, observing liquidation heatmaps and order book depth can provide insights into liquidity and potential price movements. It’s crucial to remain agile and adapt strategies based on real-time market developments.