Urgent Bitcoin Price Warning: Technical Indicators Signal Potential Drop to $114K–$115K
Are you feeling the shift in the crypto air? For weeks, Bitcoin has been riding a wave of optimism, but recent signals suggest its bullish momentum might be losing steam. Traders and investors are now on high alert as key technical indicators point to a potential significant BTC drop, possibly pulling the Bitcoin price down to the $114,000–$115,000 range. This comprehensive analysis will break down the crucial market dynamics at play, helping you understand the forces shaping Bitcoin’s immediate future.
Decoding the Technical Indicators: Why a BTC Drop Might Be Imminent
The current market landscape for Bitcoin is characterized by a blend of caution and anticipation. Several prominent technical indicators are flashing red, suggesting that a corrective phase could be on the horizon. Understanding these signals is essential for any market participant.
RSI Divergence: A Warning Sign
One of the most compelling signals is the emergence of a hidden bearish divergence in the Relative Strength Index (RSI). This pattern occurs when Bitcoin’s price manages to form higher highs, yet the RSI, a momentum oscillator, either creates equal or lower highs. This discrepancy indicates that the upward price movement is not supported by underlying buying strength, signaling weakening momentum. Historically, such divergences have often preceded corrective declines. For instance, a similar RSI divergence observed in March 2024 was followed by a 20% price drop. This precedent raises concerns that Bitcoin could be poised for another short-term pullback.
The Persistent CME Gap: A Price Magnet?
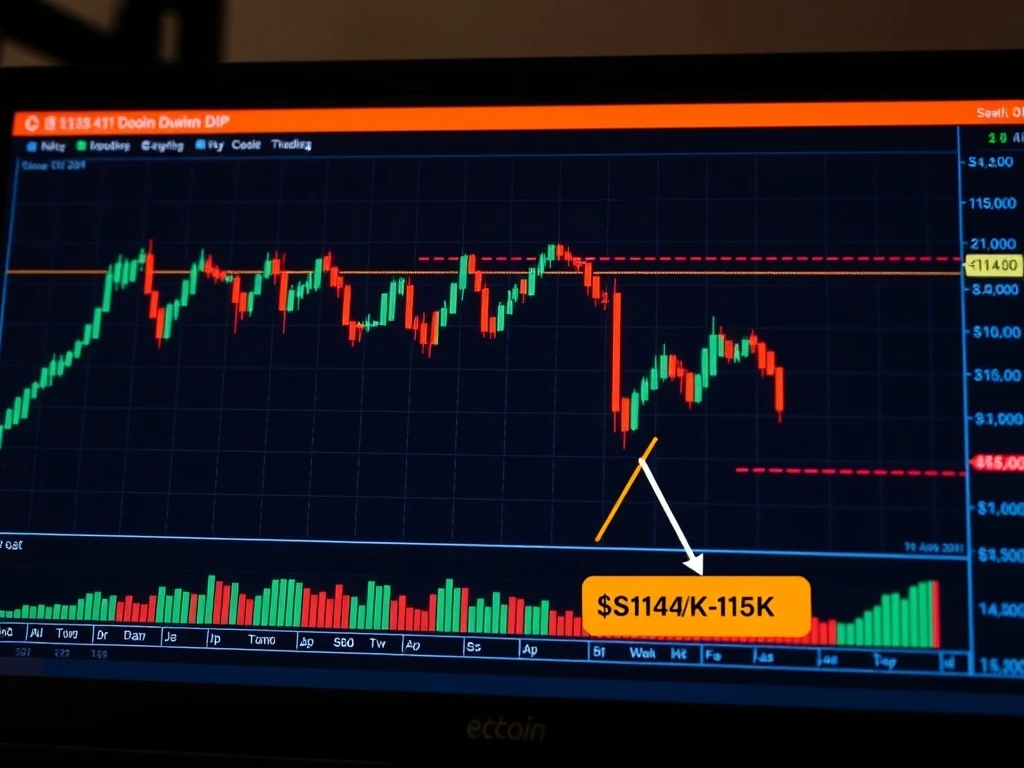
Another critical factor drawing attention is the Chicago Mercantile Exchange (CME) gap. Specifically, the gap between $114,380 and $115,635 on the daily chart has become a focal point for many traders. CME gaps occur when Bitcoin trades outside regular hours on the Chicago Mercantile Exchange, leaving untraded price ranges. These gaps often act as “magnets,” drawing the price back to “fill” these empty spaces during active sessions. Out of nine 2025 CME gaps, seven have already been filled, amplifying the likelihood of Bitcoin revisiting this level to close the $114,000 bracket. Analysts widely caution that this particular CME gap could pull the price lower in the coming weeks, acting as a powerful technical target for a potential BTC drop.
Index Bitcoin Cycle Indicator (IBCI) Enters Distribution Zone
Adding to the bearish sentiment, anonymous crypto analyst Gaah highlighted that the Index Bitcoin Cycle Indicator (IBCI) has entered a distribution zone. This zone is historically linked to periods of market euphoria and interim tops. While the current IBCI reading of 80% is below the 100% peak seen in past cycle tops—suggesting that a major end-of-cycle peak is unlikely—it still signals elevated corrective risk. This indicates that while the long-term bull market may remain intact, short-term volatility and a potential correction are highly probable. Key metrics like the Puell Multiple and STH-SOPR (Short-Term Holder Spent Output Profit Ratio) remain below mid-levels, indicating that retail speculation and miner activity have not yet peaked. Gaah emphasized that this distribution zone does not confirm a major top but underscores the potential for significant short-term volatility.
Understanding Bitcoin Price Action: Consolidation or Correction?
Bitcoin’s recent consolidation between $115,000 and $120,000 has fueled intense debate among market participants regarding its near-term direction. Is this merely a healthy consolidation before another leg up, or the prelude to a deeper correction?
On-Chain Data: Long-Term Holders and Supply Dynamics
On-chain data provides further clues. There has been a notable reduction in active supply and hesitant selling from long-term holders (LTHs), with the Coin Days Destroyed (CDD) Ratio hitting historic levels. This behavior suggests that LTHs may be gradually distributing their positions, a common precursor to exhaustion in holding patterns. However, the absence of aggressive, panic-driven selling has led some analysts to view the potential retest of the $115,000 level as a consolidation phase rather than a full-blown bearish breakdown. This suggests that while selling pressure exists, it is not yet overwhelming, leaving room for a potential rebound.
Key Levels to Watch for the Bitcoin Price
The intraday volatility has further complicated the outlook. A sharp drop to $117,634 on July 24 highlighted the fragility of Bitcoin’s price structure, with the $118,000 psychological threshold appearing to cap upward momentum. Market participants are now closely monitoring the $115,000–$118,000 range. A sustained breakdown below this range could trigger deeper corrections, potentially extending beyond the $114,000 mark. Conversely, a robust rally above $122,000 with strong volume could reignite bullish sentiment, potentially driving the price toward $124,000–$130,000 by early August. However, this bullish scenario hinges on sustained buyer participation and favorable macroeconomic conditions, as well as positive ETF inflow dynamics.
Navigating the Crypto Market Analysis: What’s Next?
The $115,000 level has emerged as a critical technical and psychological anchor for Bitcoin. The confluence of historical data, such as the tendency for CME gaps in this range to get filled, and the IBCI’s entry into a distribution zone, strongly reinforces the likelihood of a near-term correction. While the long-term bull trend for Bitcoin remains widely anticipated, traders are advised to prepare for heightened volatility as the asset navigates this pivotal phase.
The coming days will likely determine whether the current consolidation transforms into a sustained rally or if Bitcoin faces a more pronounced dip toward the $114,000 level. Keeping a close eye on volume, macro-economic news, and the aforementioned technical indicators will be crucial for making informed decisions in this dynamic market.
Frequently Asked Questions (FAQs)
Q1: What is a hidden bearish divergence in RSI and why is it significant for Bitcoin price?
A hidden bearish divergence occurs when Bitcoin’s price makes higher highs, but its Relative Strength Index (RSI) makes lower or equal highs. This pattern indicates that the upward momentum is weakening, even if the price is still rising, often preceding a corrective price drop. It suggests that buying pressure is diminishing, making the asset vulnerable to a pullback.
Q2: What is a CME gap and how does it influence Bitcoin’s price?
A CME gap refers to an untraded price range on the Chicago Mercantile Exchange Bitcoin futures chart. These gaps form when Bitcoin’s price moves significantly outside of regular CME trading hours. Historically, Bitcoin often revisits these levels to “fill” the gap, acting as a price magnet. The current CME gap between $114,380 and $115,635 is a key level that many analysts believe Bitcoin will eventually retest.
Q3: What does the Index Bitcoin Cycle Indicator (IBCI) entering a distribution zone mean?
The IBCI entering a distribution zone suggests that the market is in a phase typically associated with euphoria and interim market tops. While it doesn’t necessarily signal the end of a long-term bull cycle, it does indicate elevated risk for short-term corrections and increased volatility. It’s a period where some long-term holders might begin to distribute their assets.
Q4: What are the critical support and resistance levels for Bitcoin currently?
The critical support range is identified between $114,000 and $115,000, particularly due to the CME gap. The immediate psychological threshold is $118,000. For a bullish reversal, Bitcoin needs to break above $122,000 with strong volume, which could then target $124,000–$130,000. A sustained breakdown below $115,000 could trigger deeper corrections.
Q5: Is this potential BTC drop a sign of the end of the bull market?
Based on current crypto market analysis, a drop to the $114K-$115K range is generally viewed as a potential short-term correction or consolidation phase, rather than the end of the long-term bull market. Indicators like the IBCI suggest an interim top risk, but not a cycle-ending peak. Long-term holders are showing hesitant distribution, not panic selling, which further supports the idea of a correction within an ongoing uptrend.